Output Gallery
Real server outputs generated from every example dataset under
data/examples/ — result pages, figures, and reports
produced by the same code paths as live analyses.
Generated 2026-09-21 02:10:45.
cat_g_field_data_plots.csv
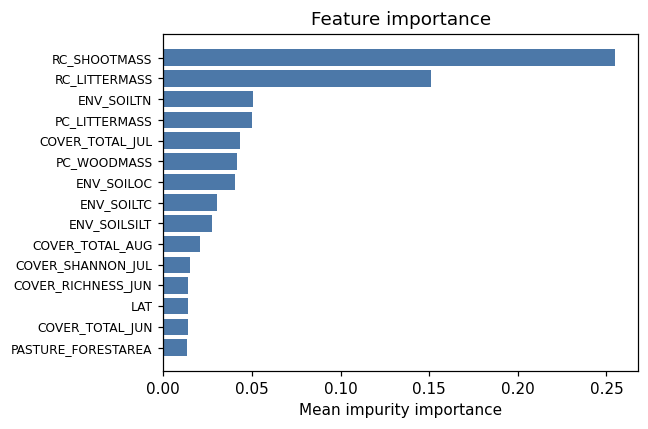
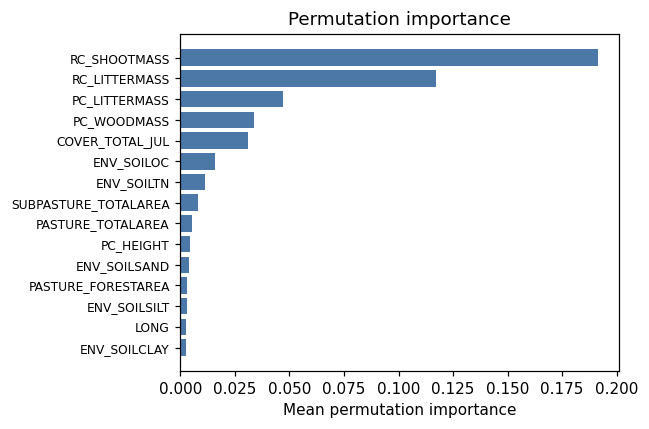
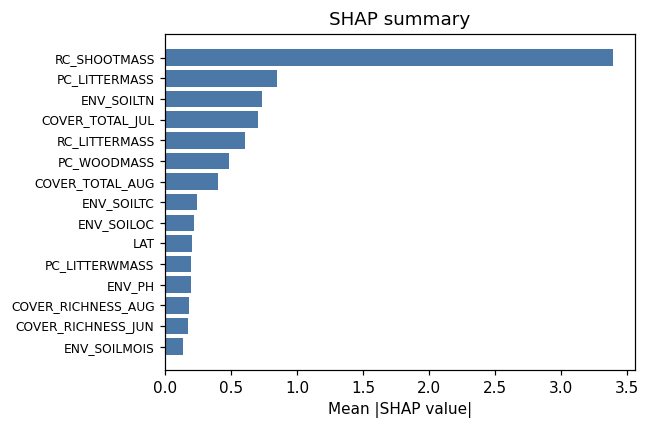
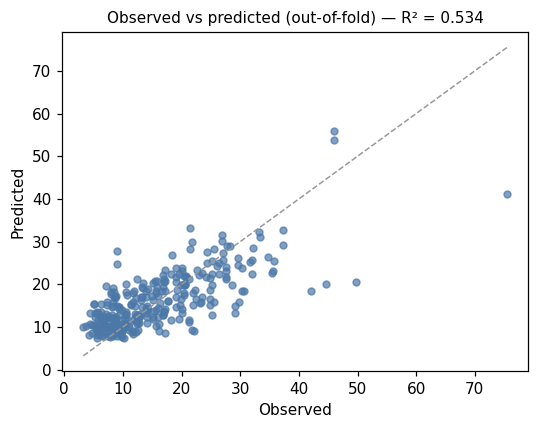
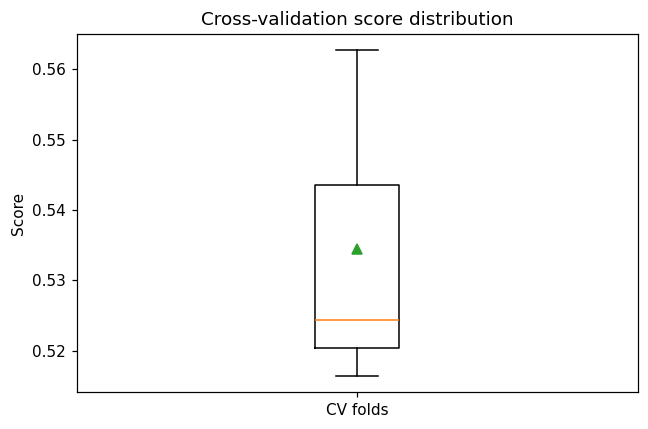
Random Forest regression — shoot biomass
ok 34.7s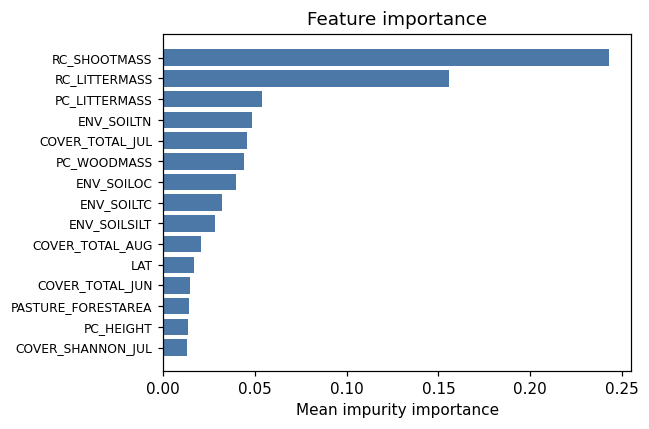
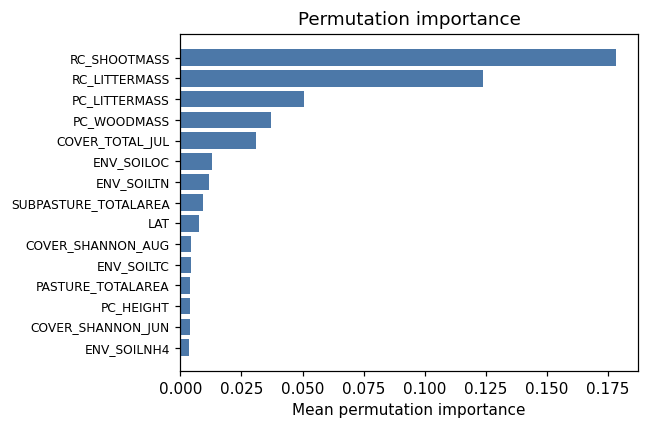
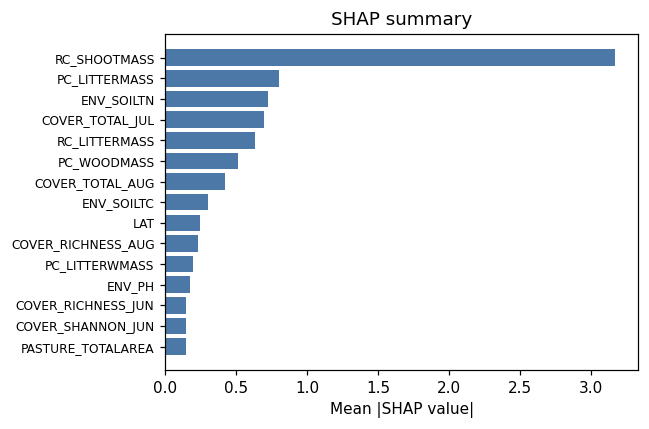
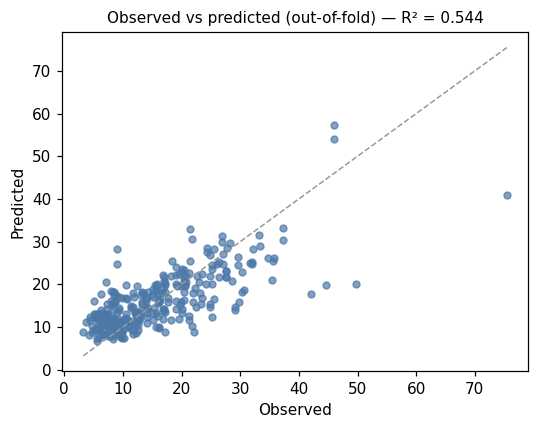
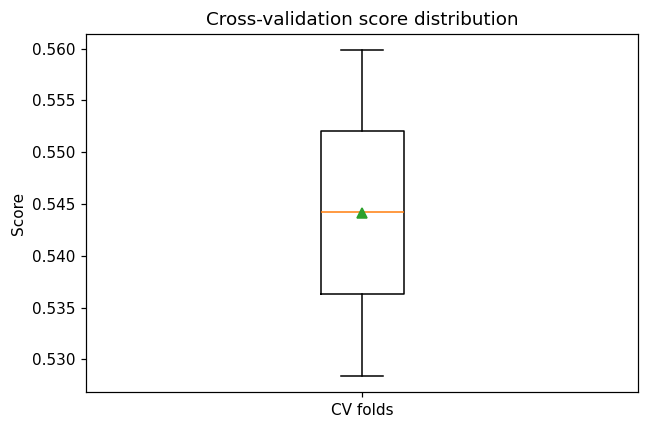
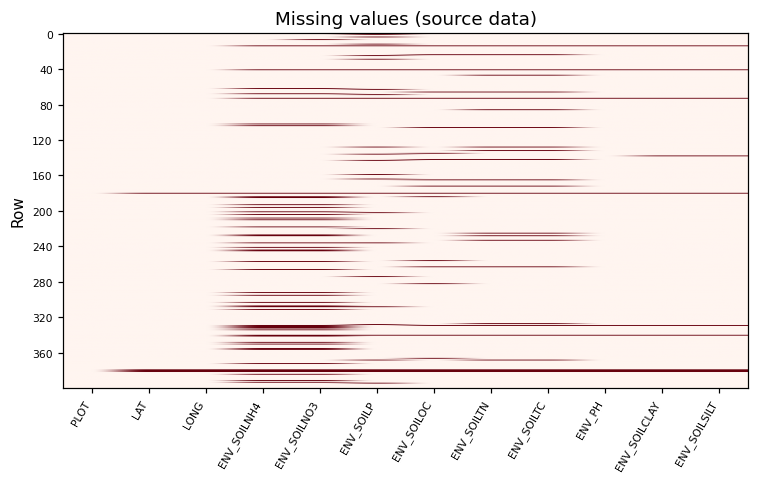
Median impute + standardize → Random Forest
ok 32.1s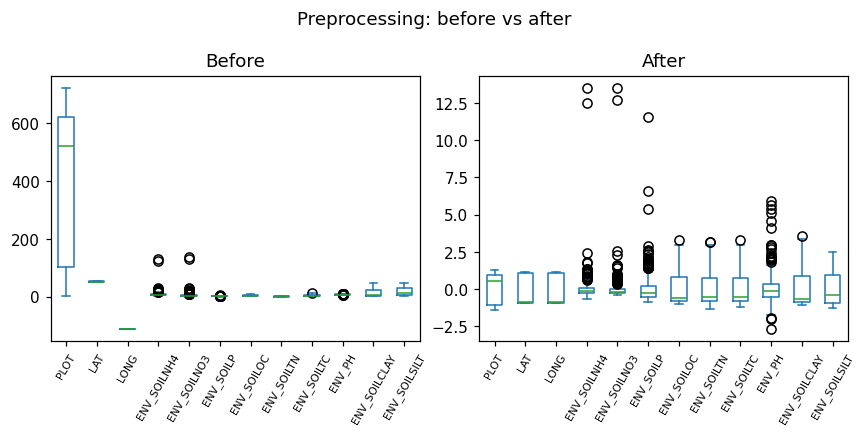
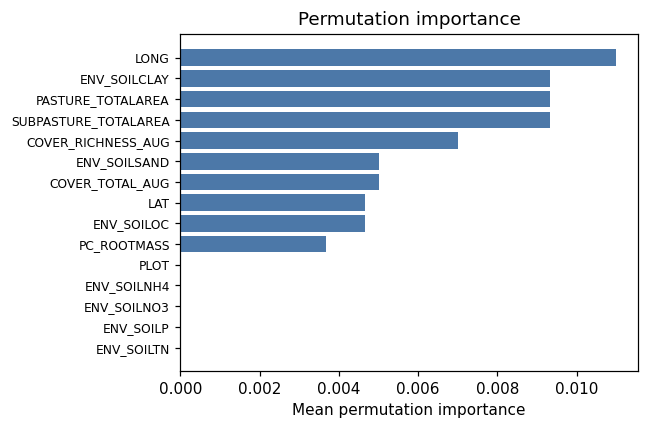
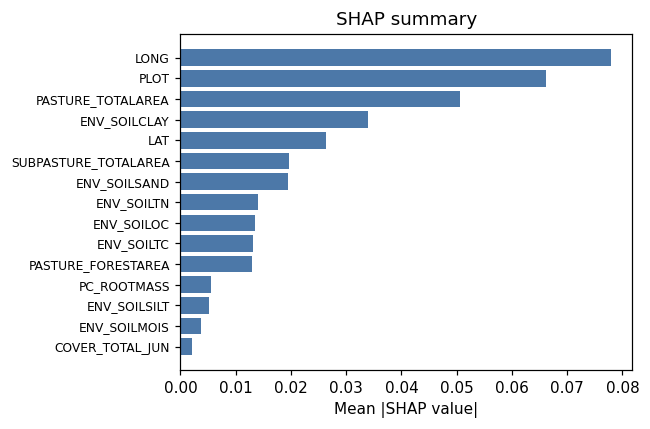
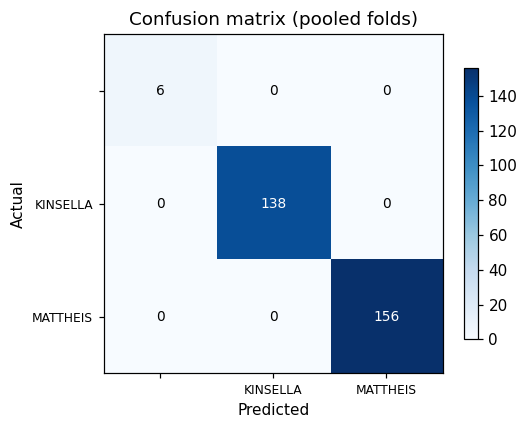
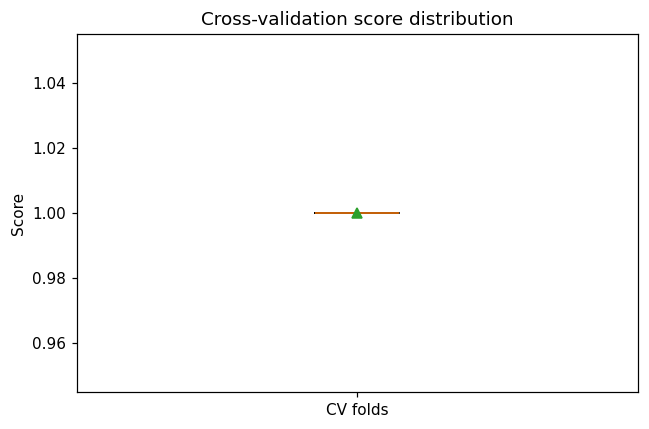
Random Forest classification — RANCH
ok 22.2s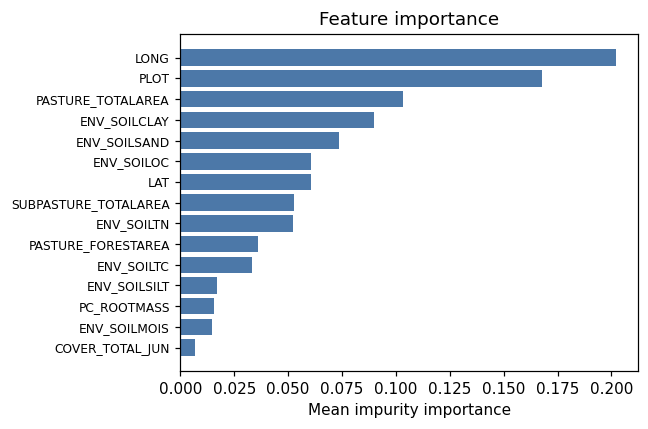
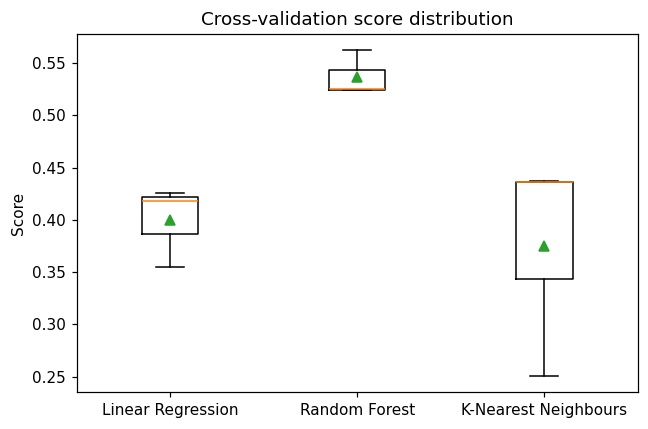
Model comparison — shoot biomass
ok 7.0s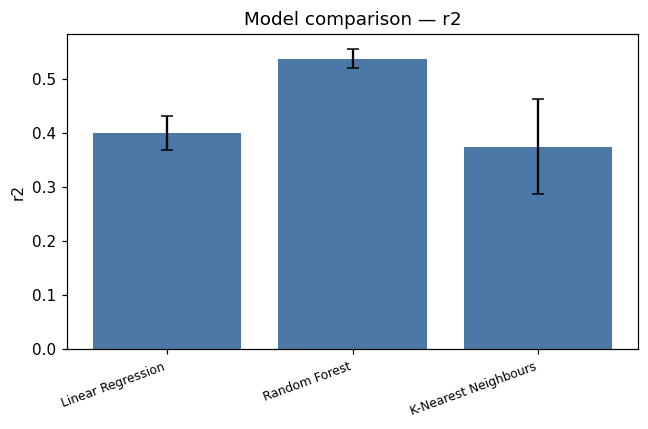
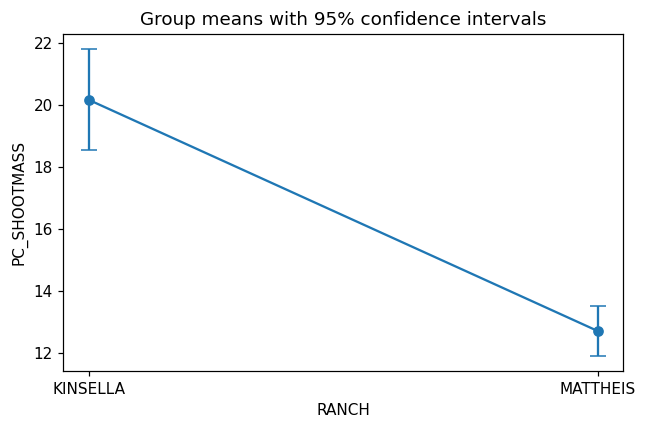
ANOVA — biomass across ranches
ok 2.4s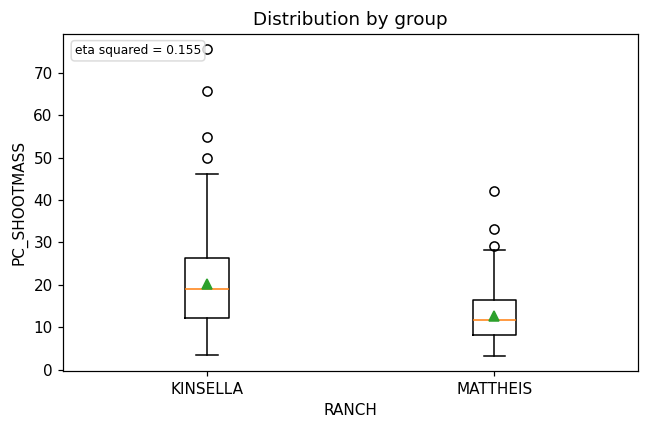
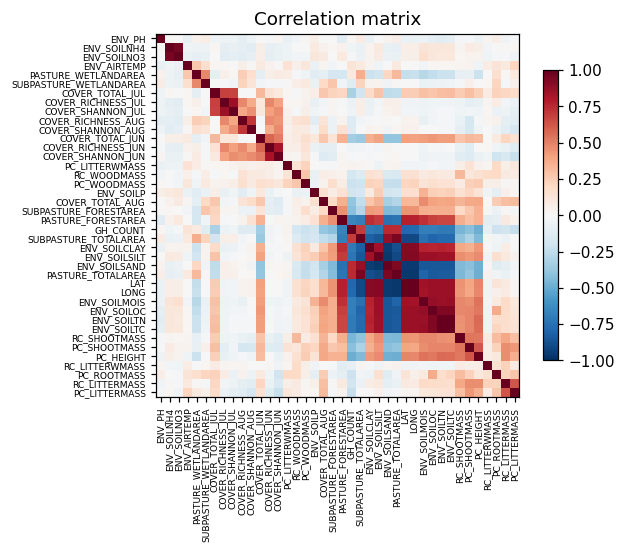
Correlation analysis
ok 12.3s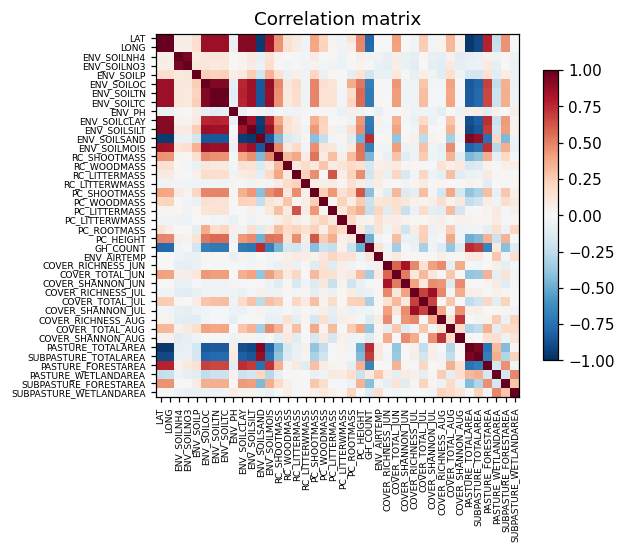
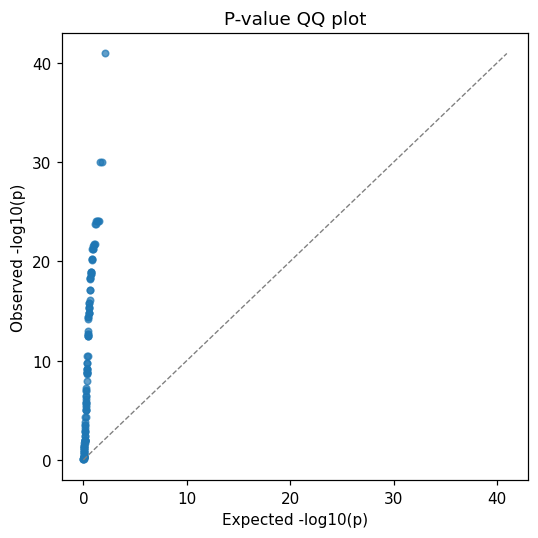
Univariate screening — shoot biomass
ok 2.9s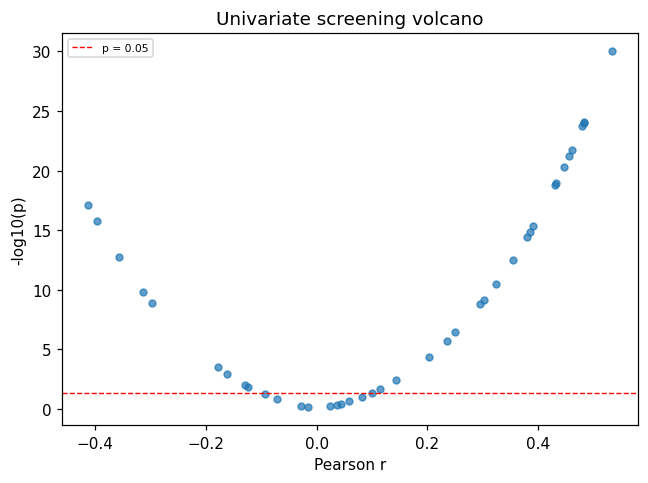
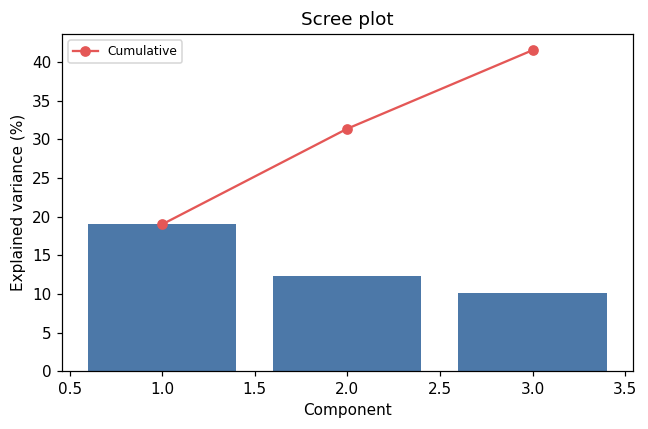
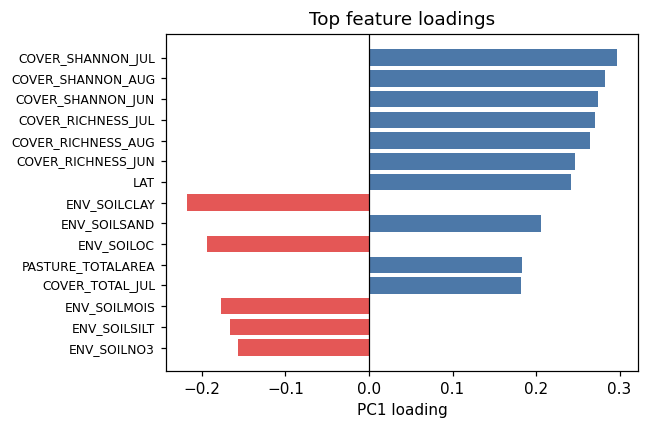
PCA ordination
ok 5.7s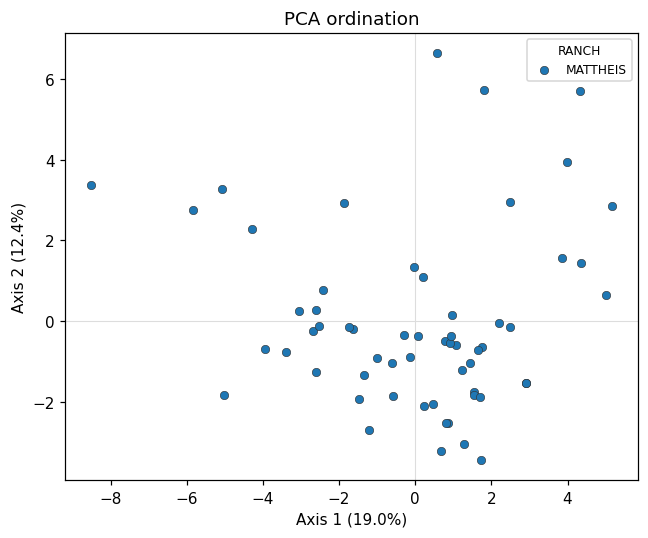
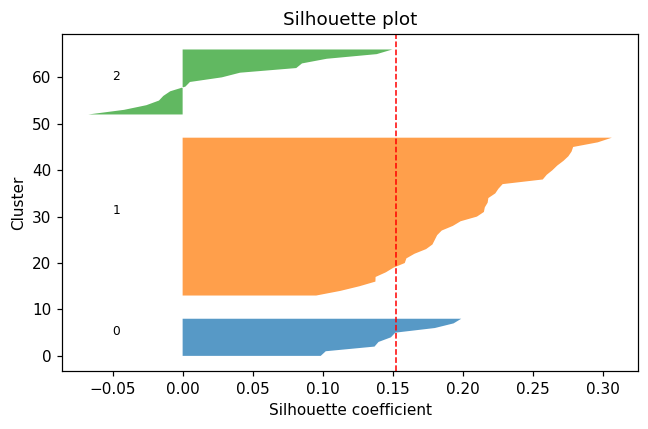
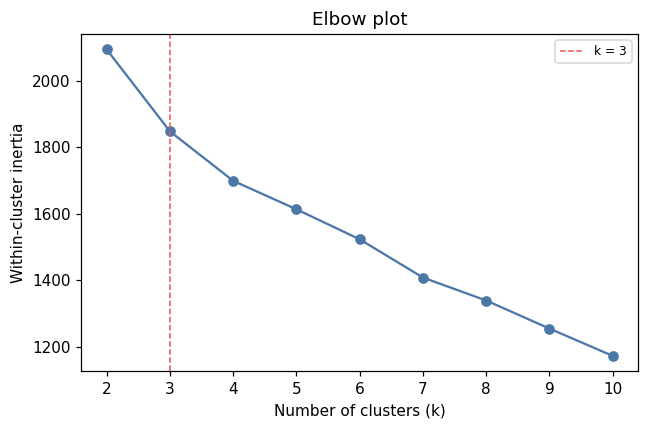
K-means clustering
ok 6.8s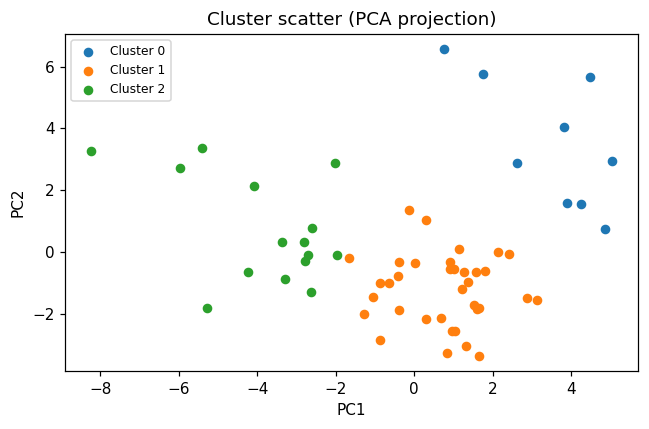
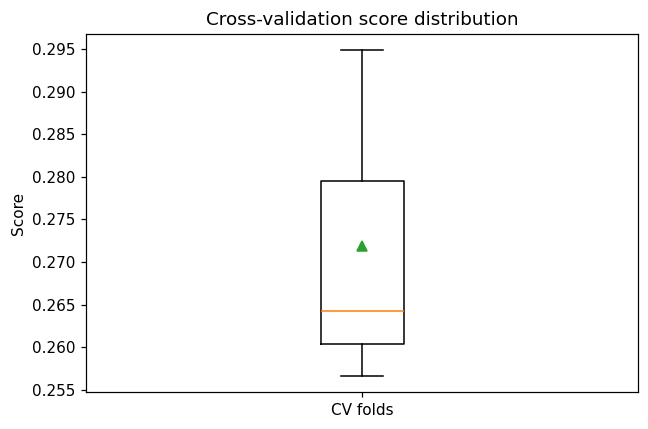
Full pipeline — shoot biomass
ok 3.9s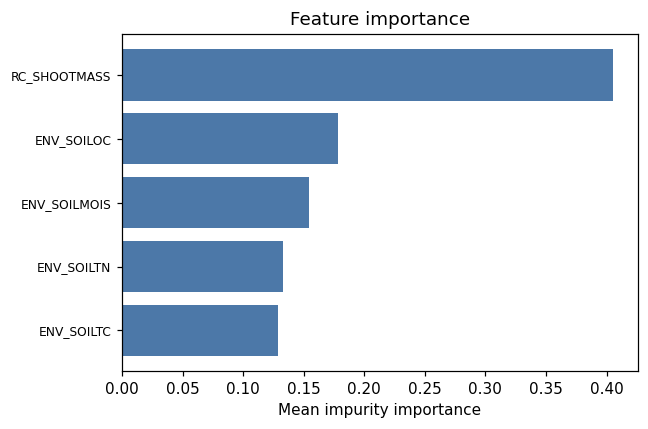
catg_example_01_forage_biomass.csv
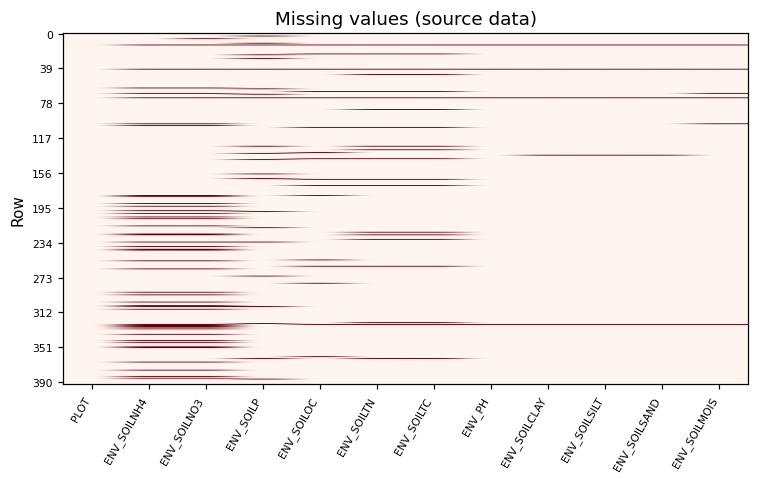
KNN impute + min-max + IQR outlier flag → Random Forest
ok 31.2s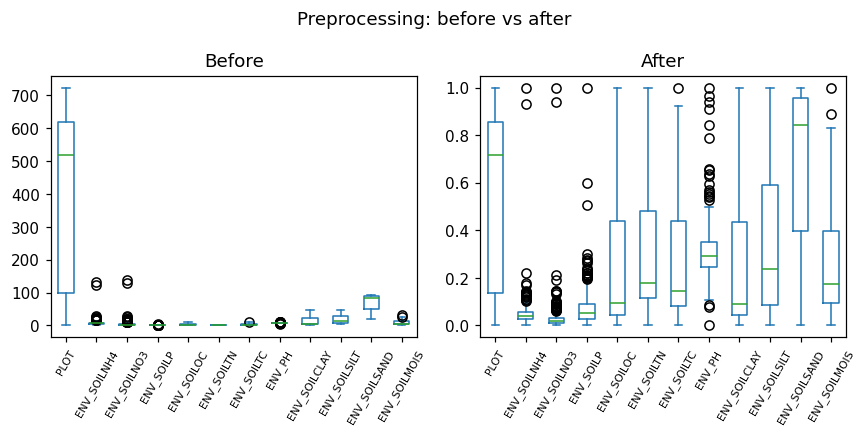
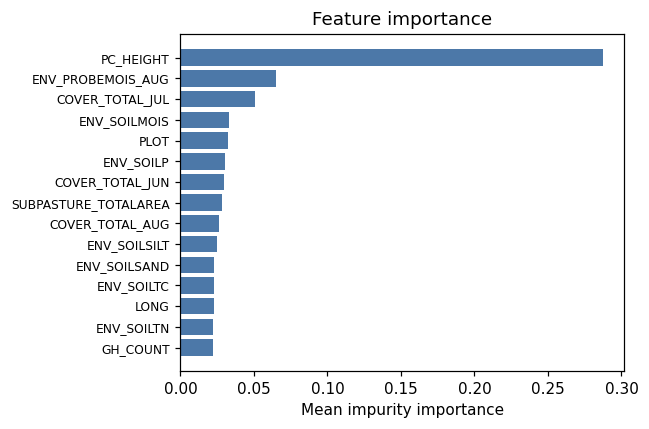
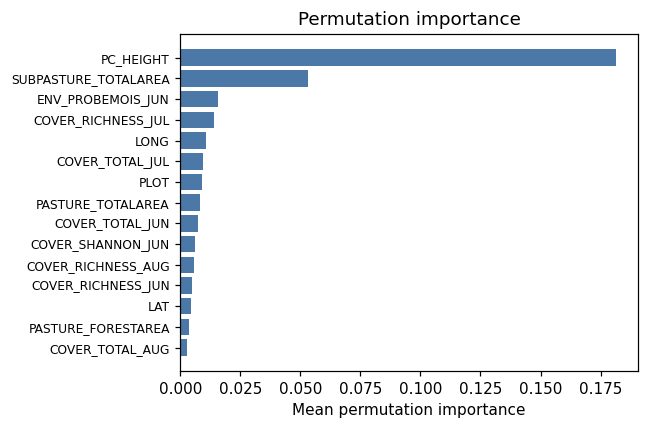
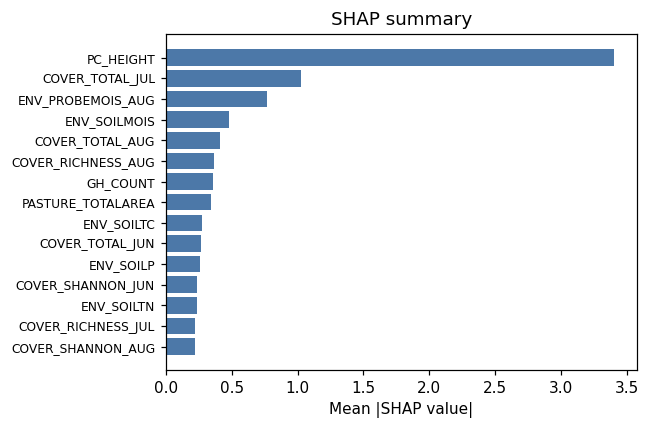
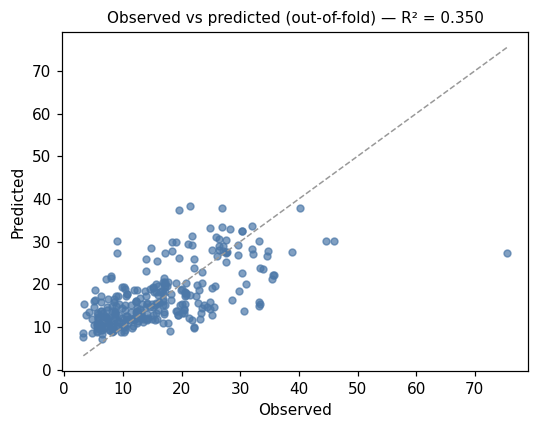
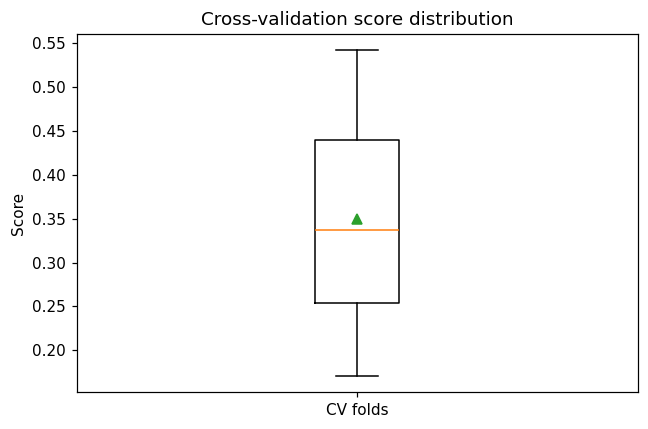
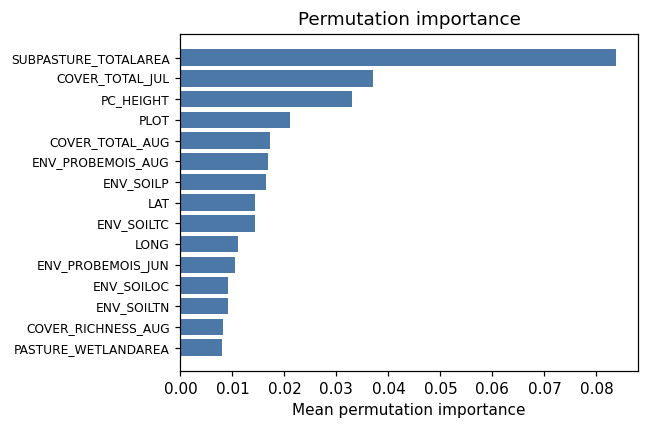
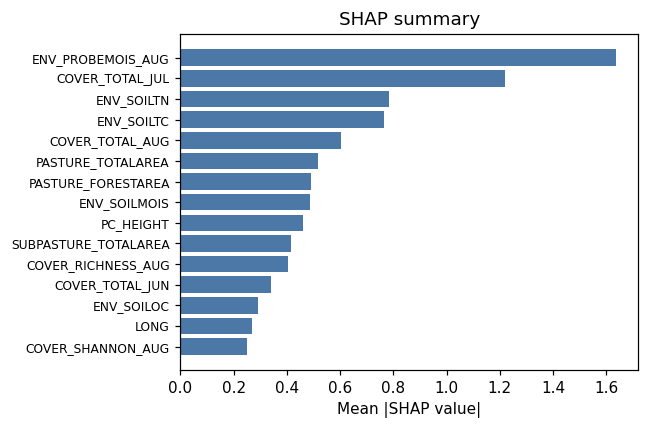
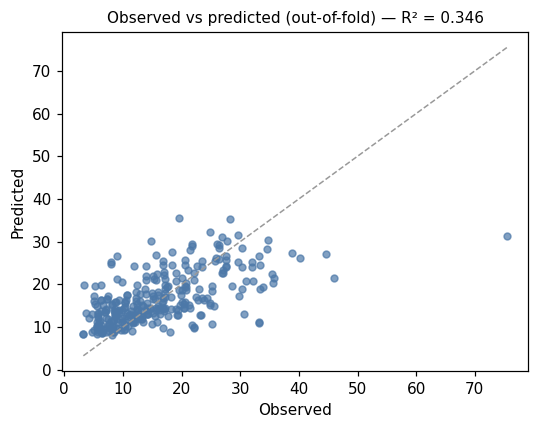
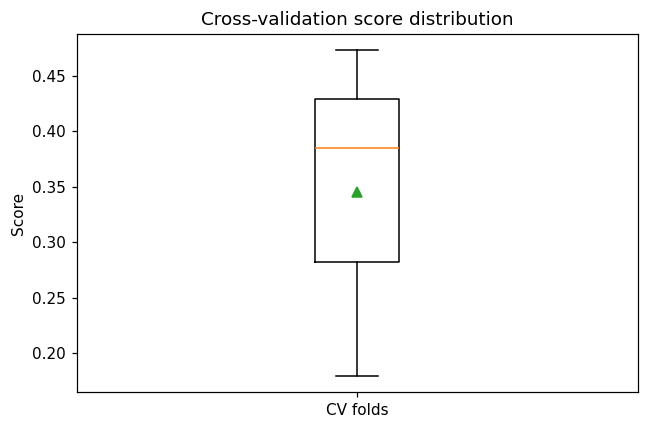
Random Forest — forage biomass
ok 19.3s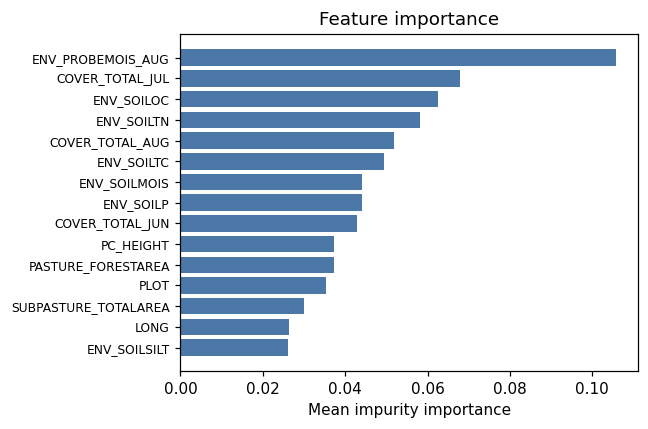
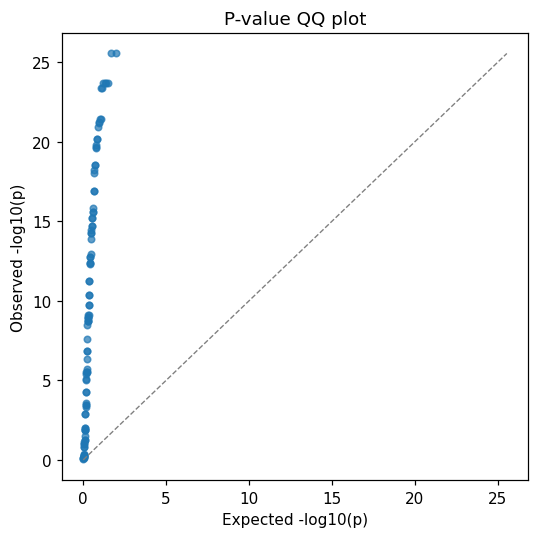
Univariate screening
ok 3.1s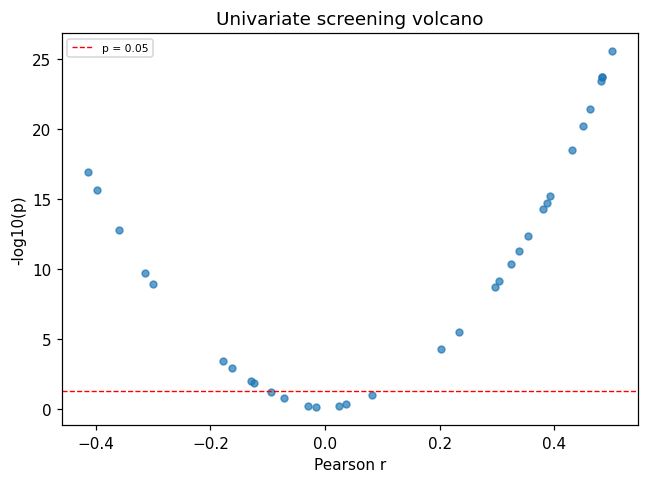
catg_example_02_grazing_carrying_capacity.csv
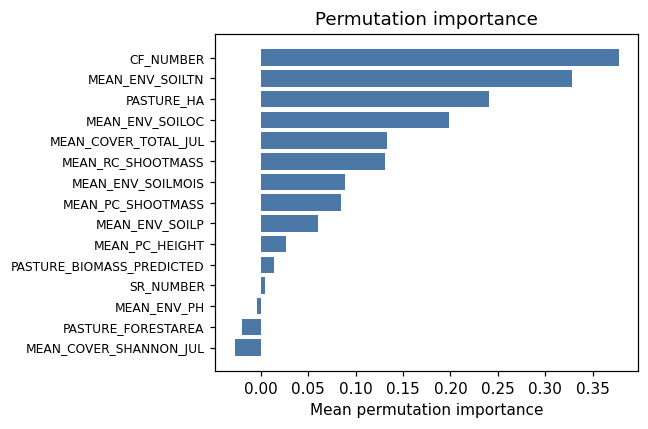
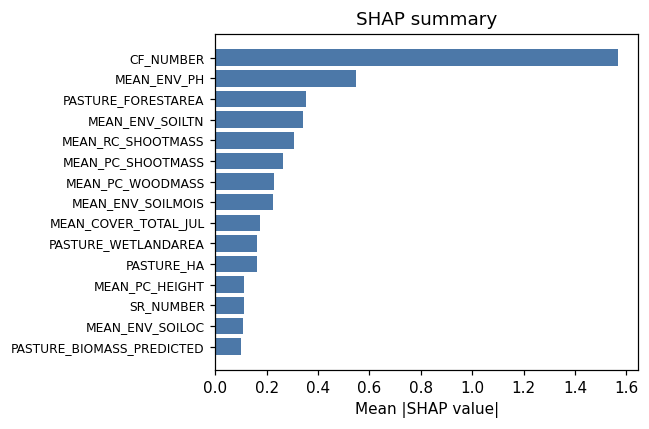
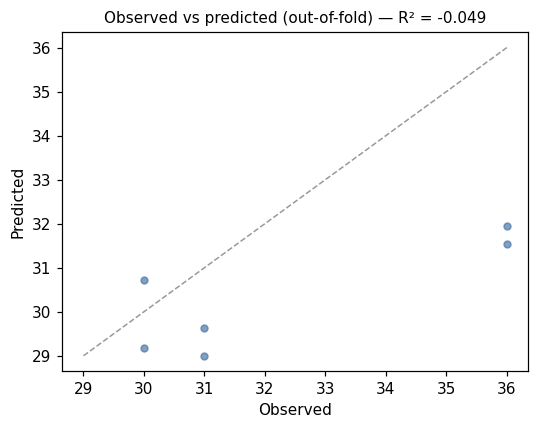
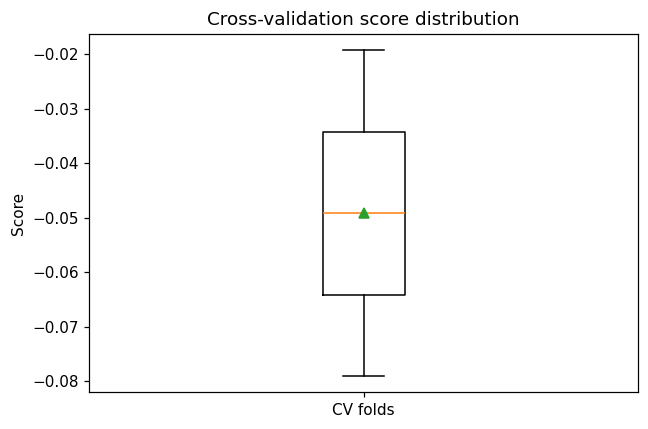
Random Forest — cow-weeks (small-n)
ok 11.6s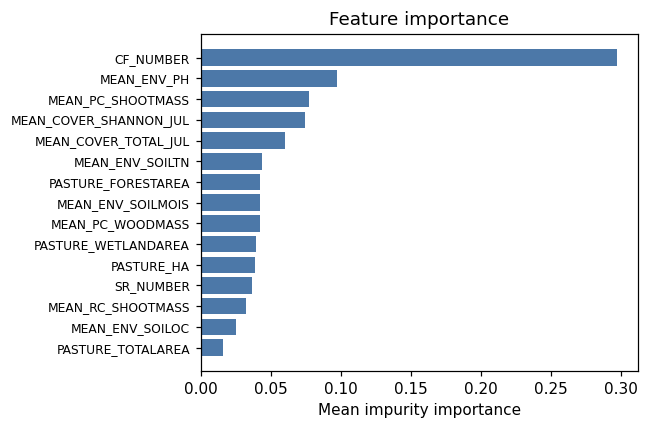
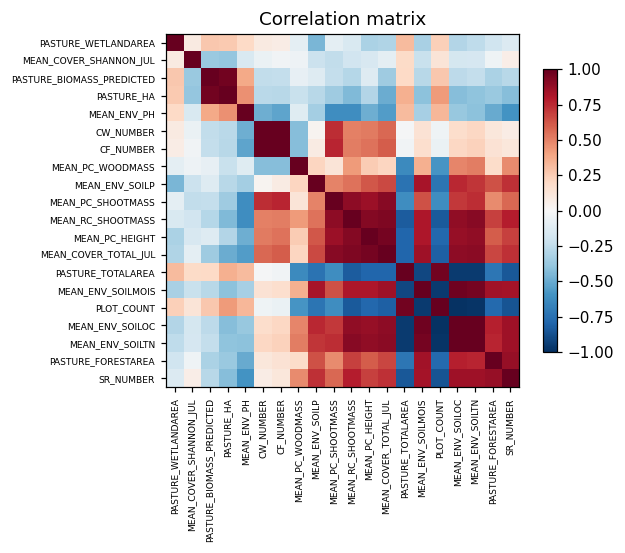
Correlation analysis
ok 6.4s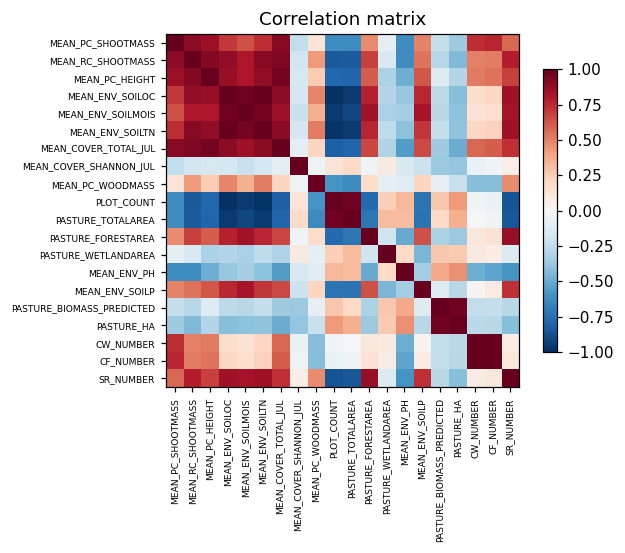
catg_example_03_soil_nitrogen_availability.csv
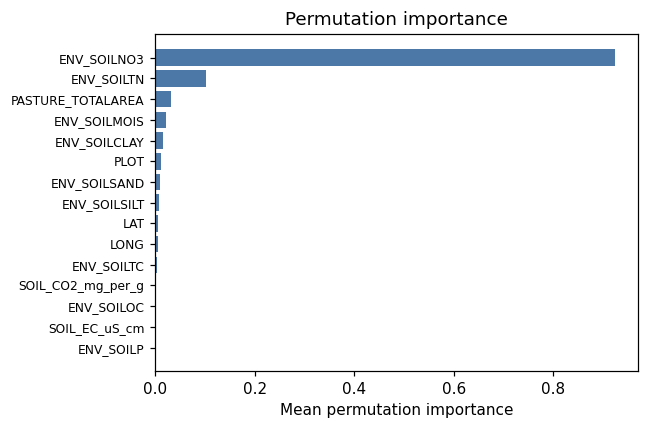
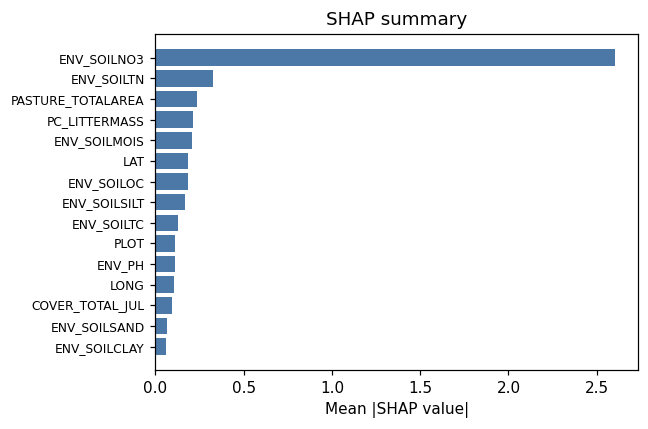
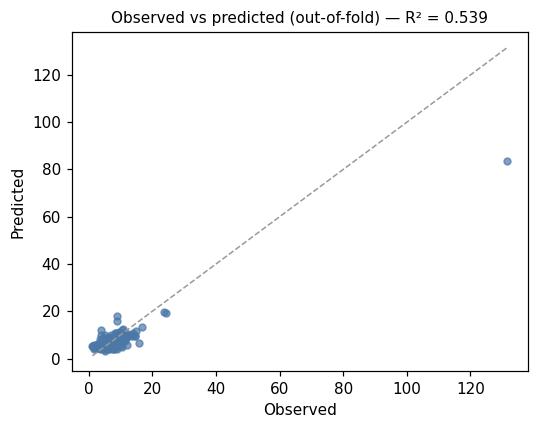
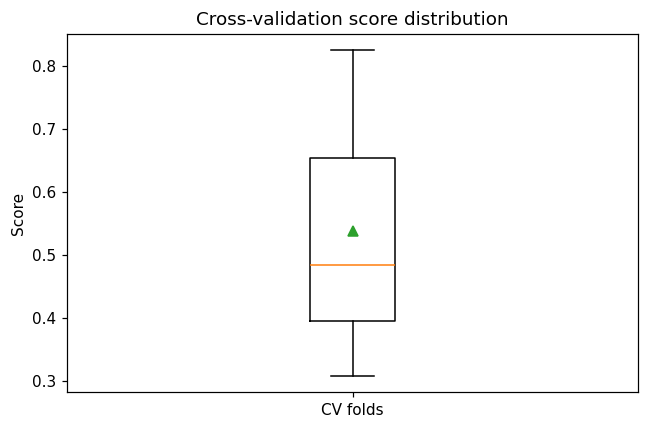
Random Forest — ammonium-N
ok 14.4s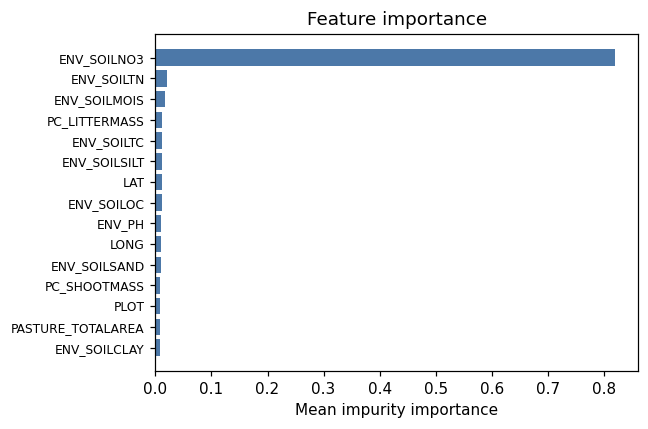
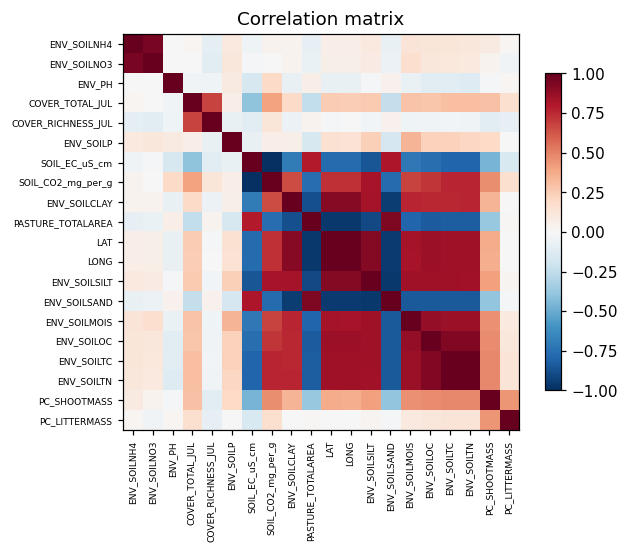
Correlation analysis
ok 6.0s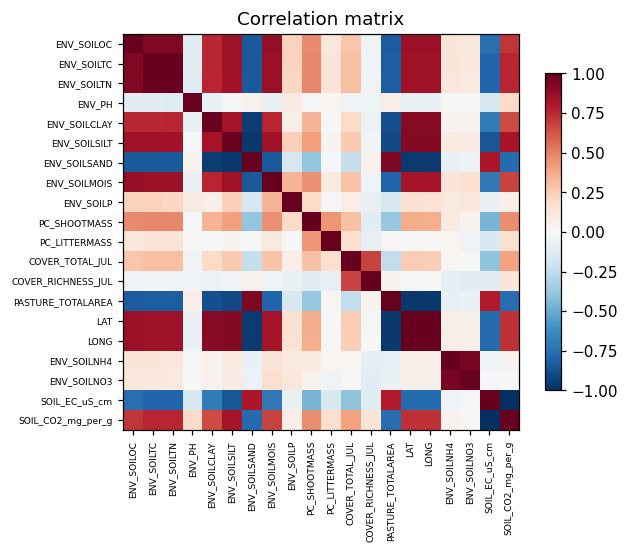
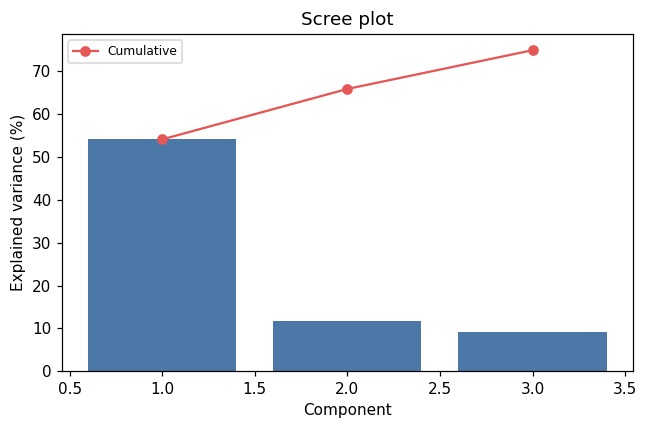
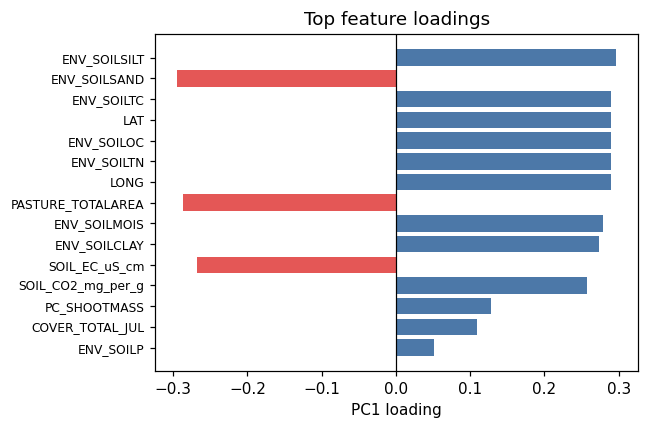
PCA ordination
ok 5.1s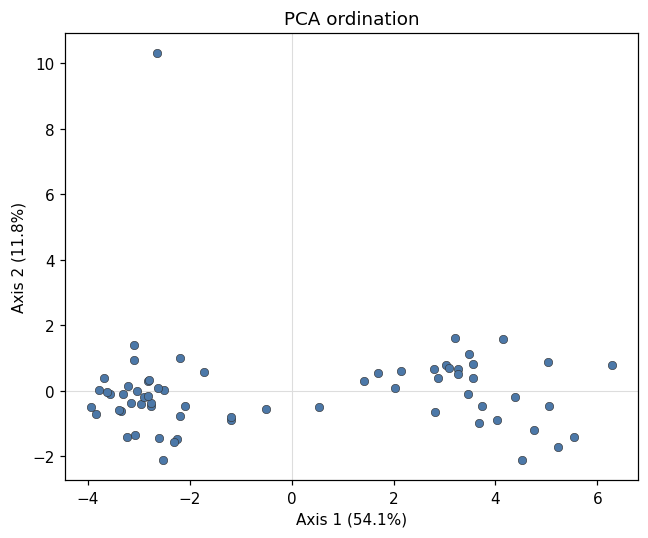
catg_example_04_vegetation_diversity.csv
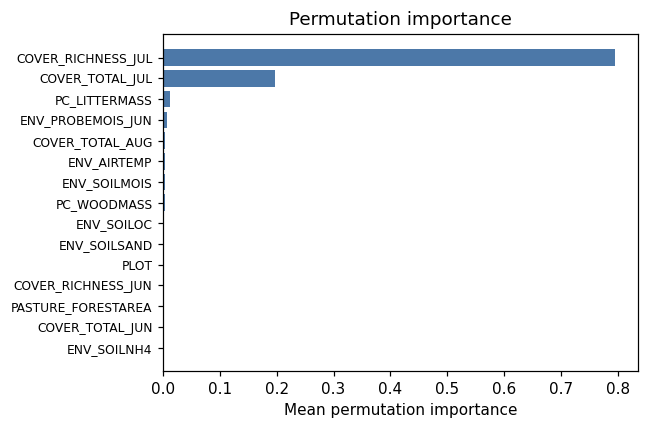
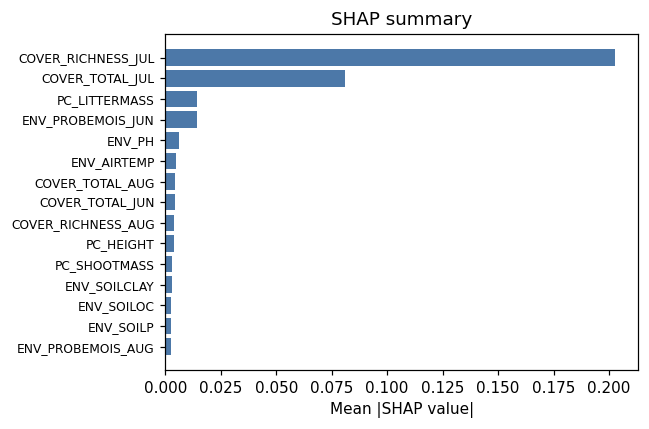
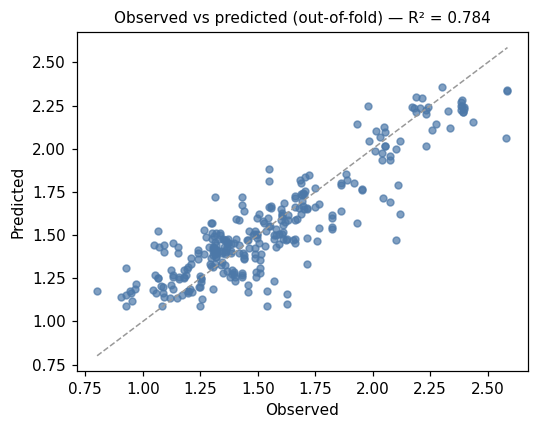
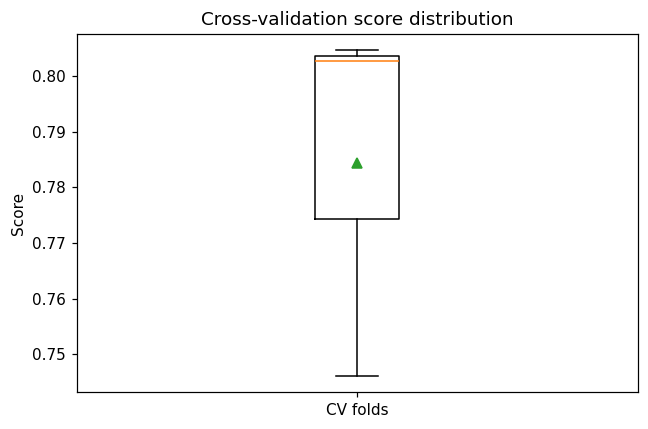
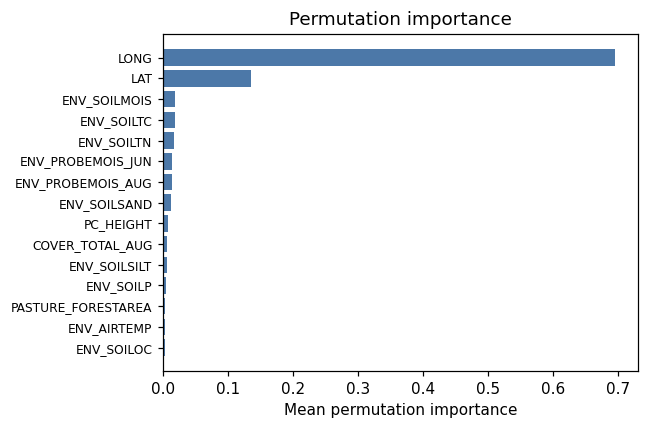
Random Forest — Shannon diversity
ok 18.2s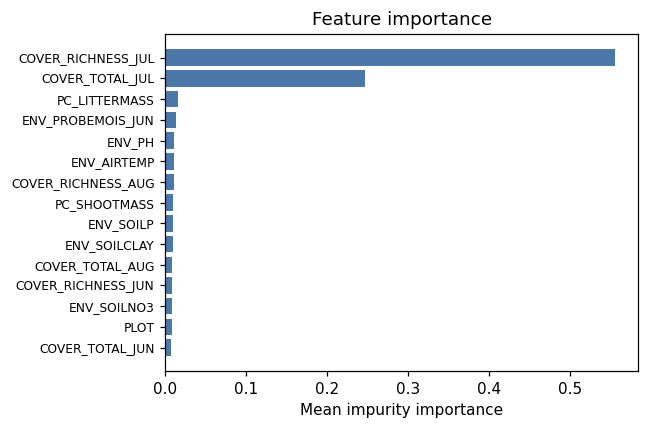
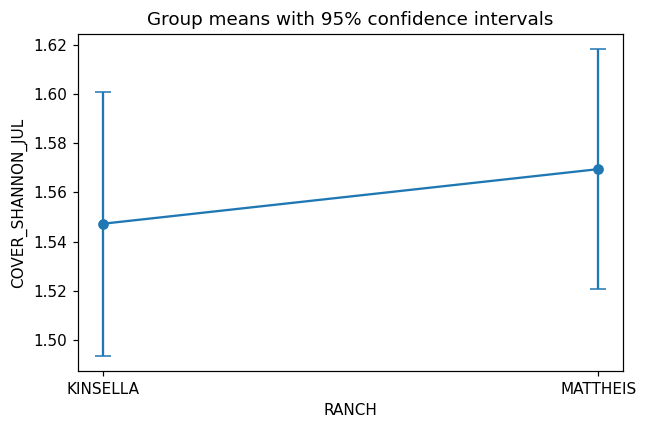
Kruskal-Wallis — diversity across ranches
ok 2.3s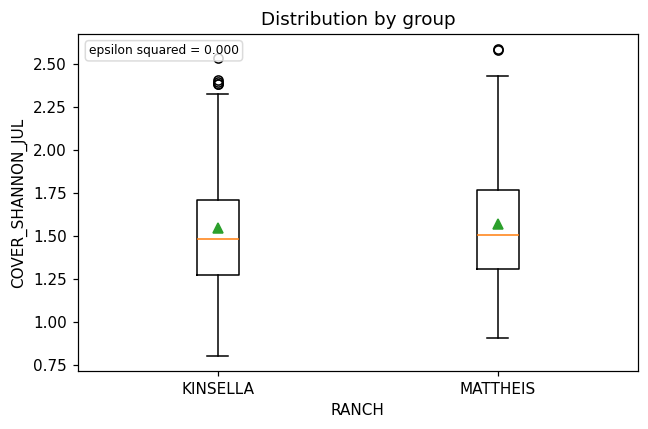
catg_example_05_grasshopper_pest_pressure.csv
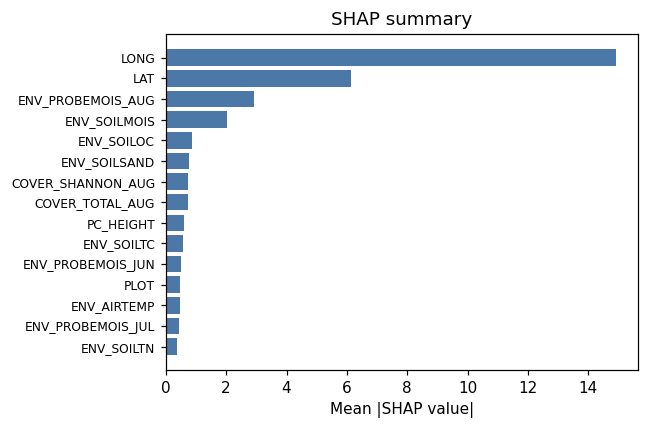
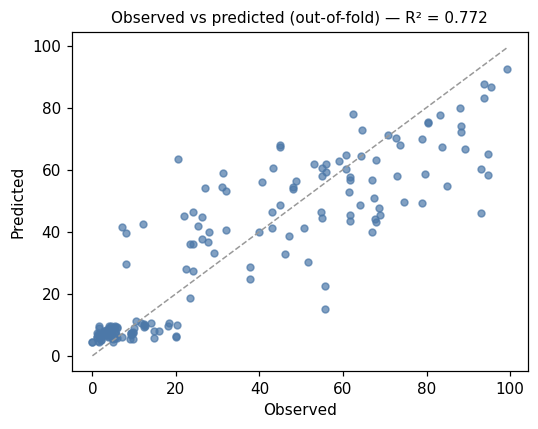
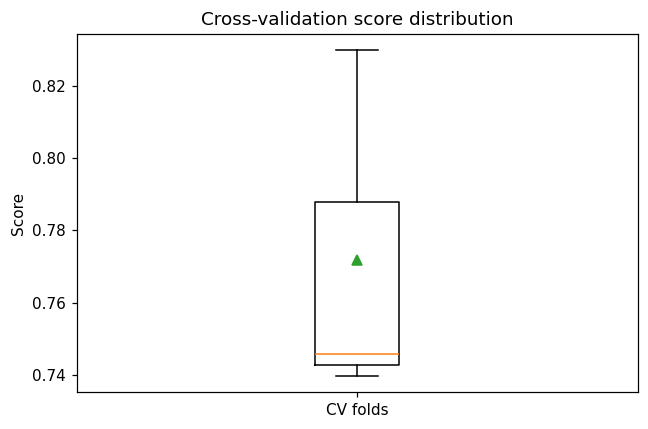
Random Forest — grasshopper count
ok 18.3s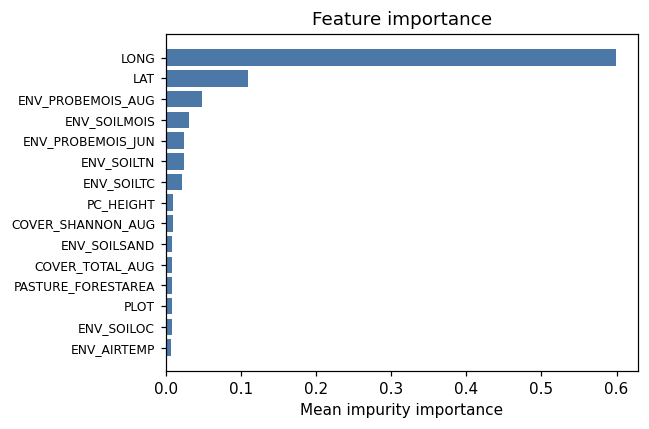
Poisson GLM — pest counts
ok 4.5s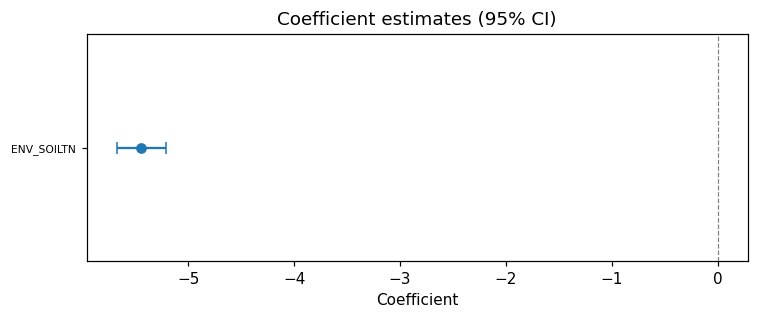
catg_example_06_soil_carbon_credits.csv
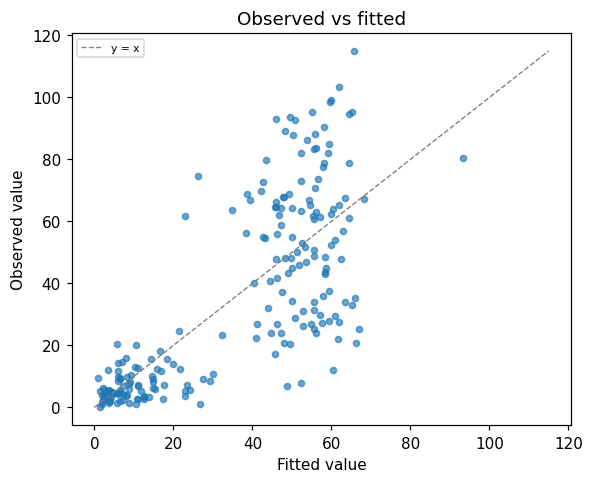
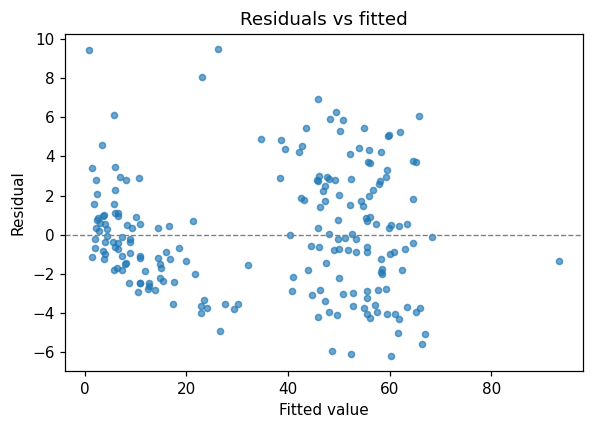
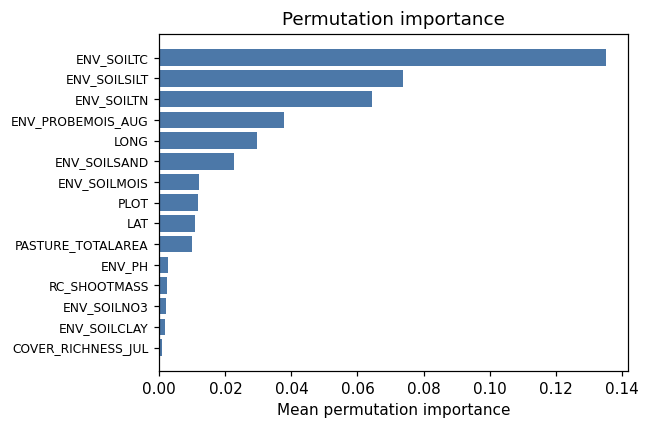
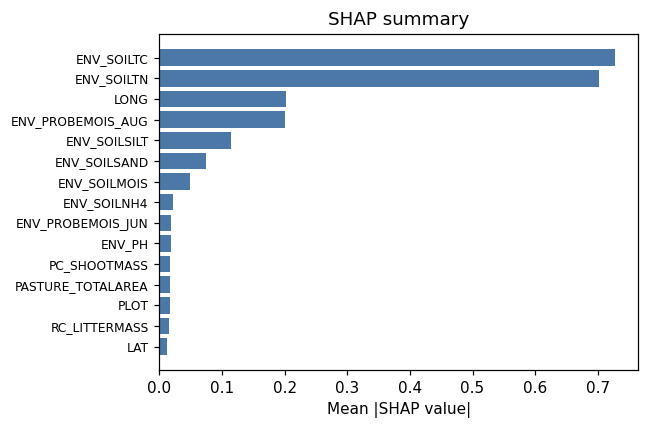
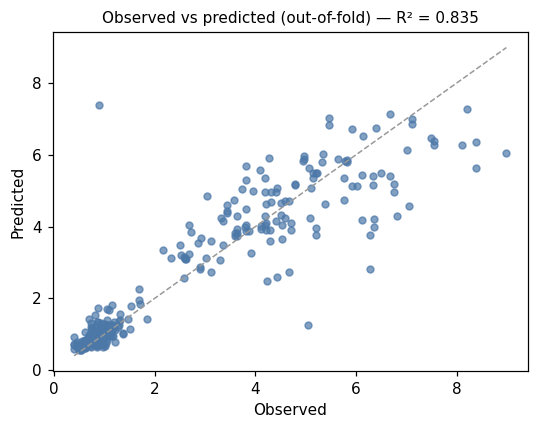
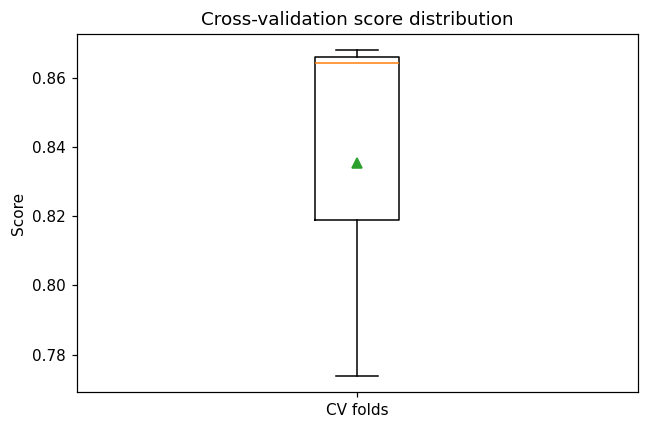
Random Forest — soil organic carbon
ok 18.3s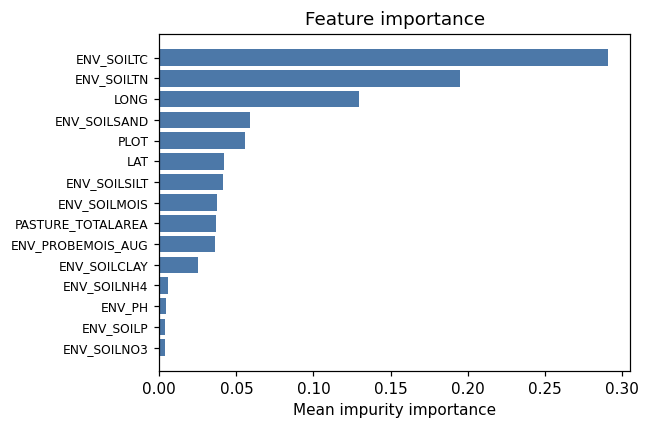
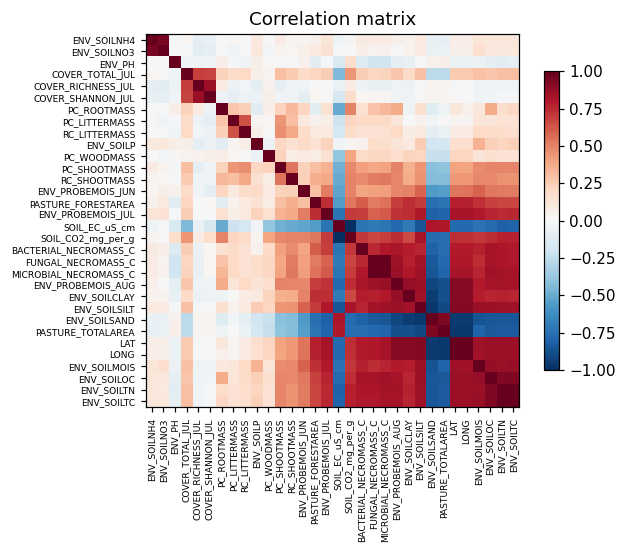
Correlation analysis
ok 9.0s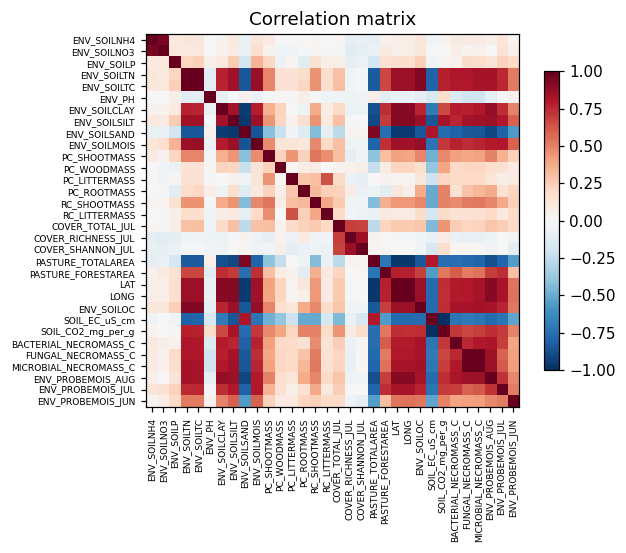
catg_example_07_microbial_soil_biology.csv
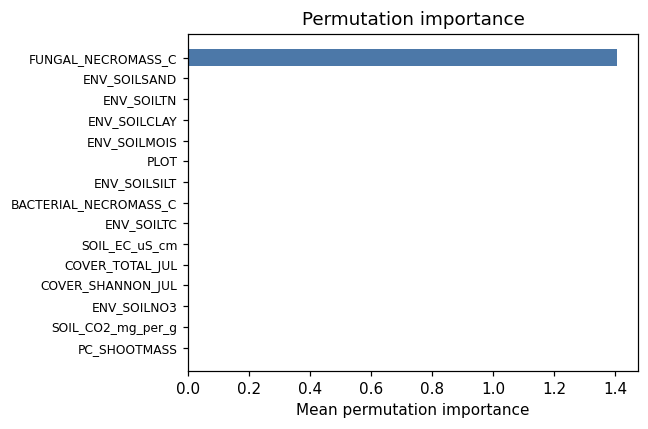
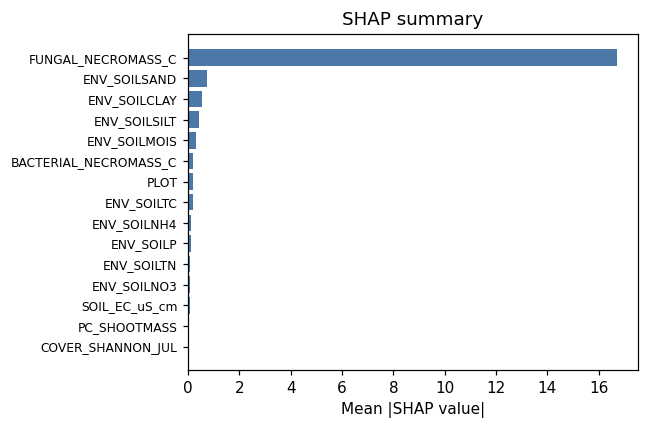
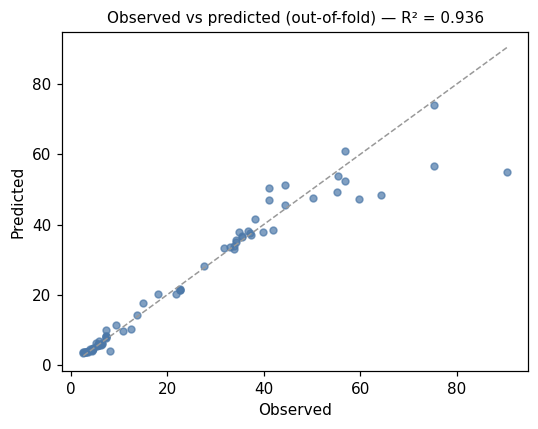
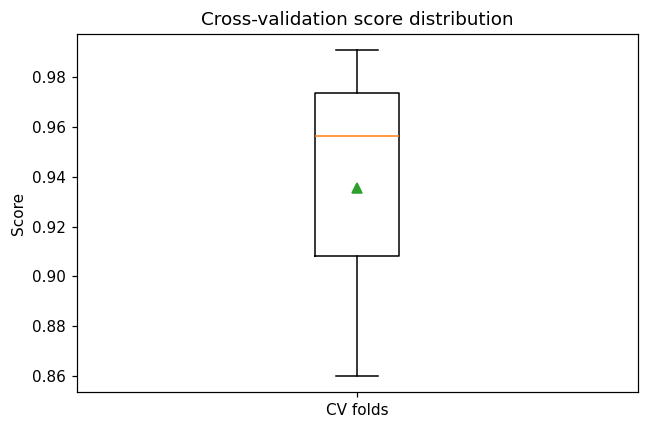
Random Forest — microbial necromass C
ok 13.8s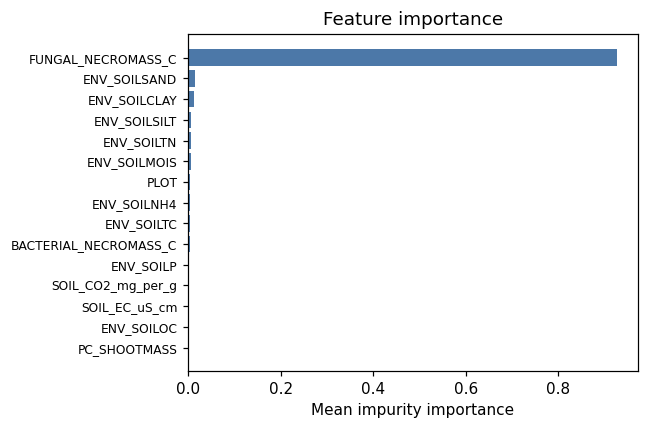
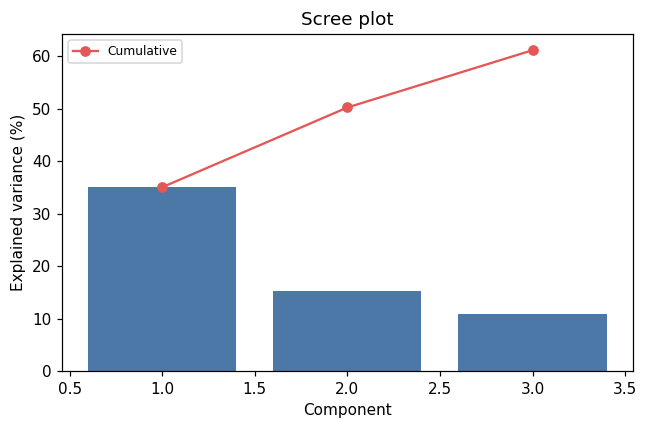
PCA ordination
ok 4.7s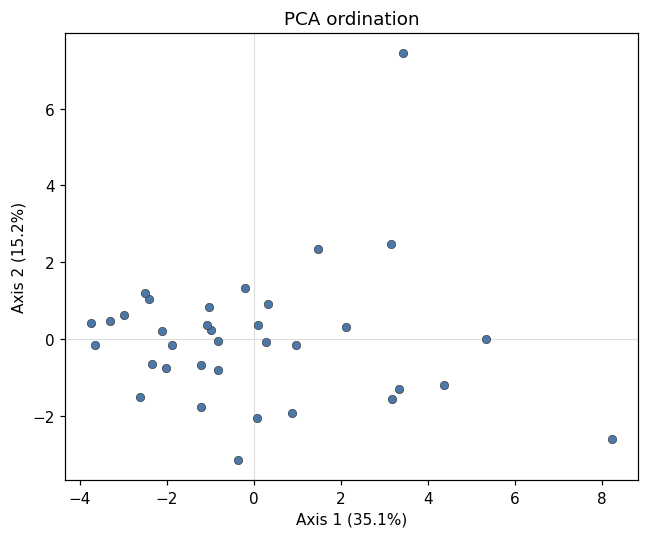
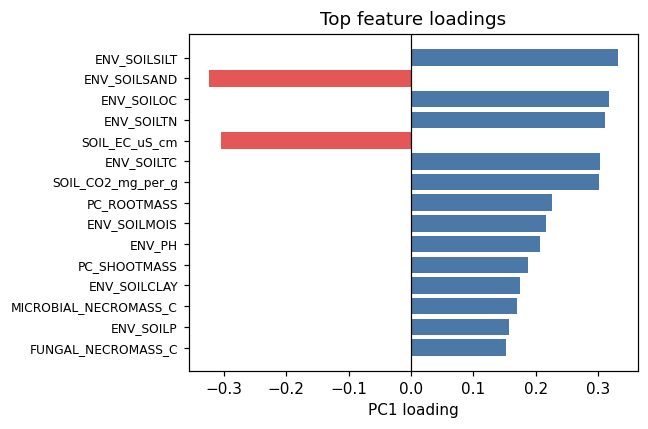
catg_example_08_woody_encroachment.csv
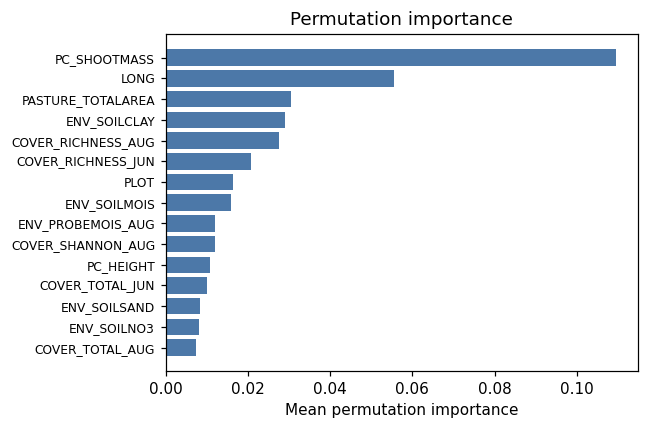
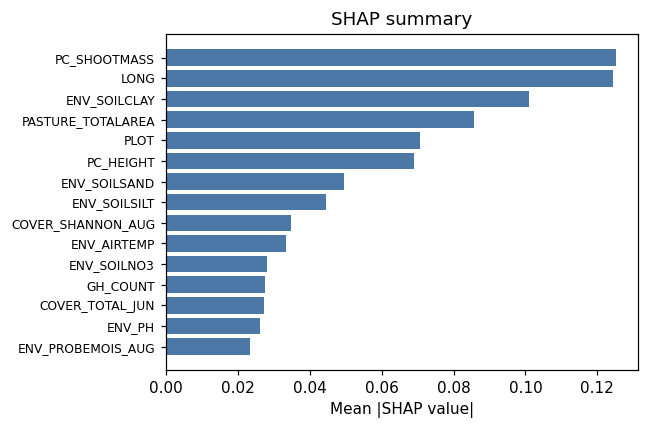
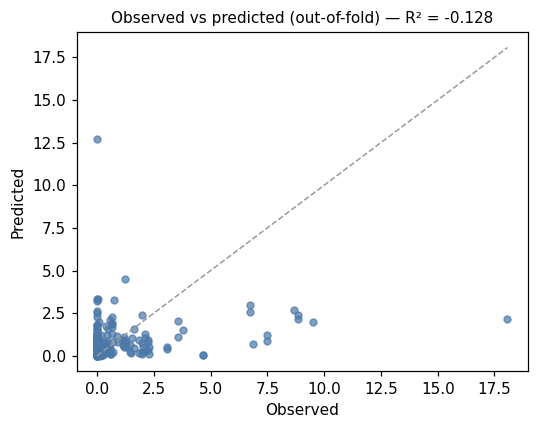
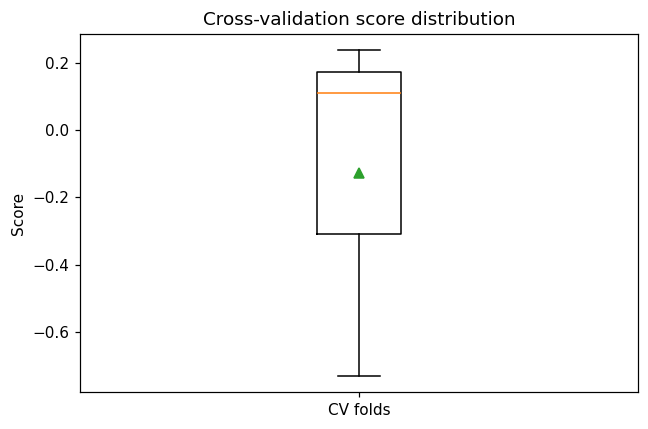
Random Forest — woody biomass
ok 18.7s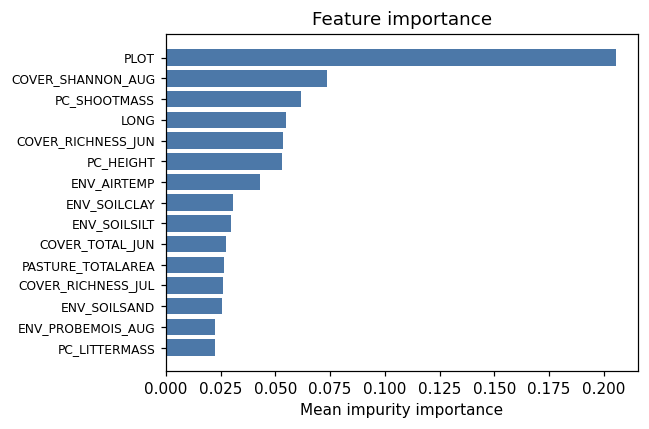
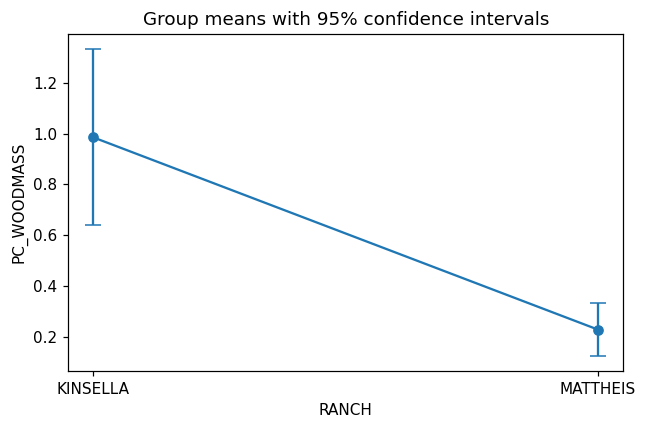
Mann-Whitney — woody mass by ranch
ok 2.9s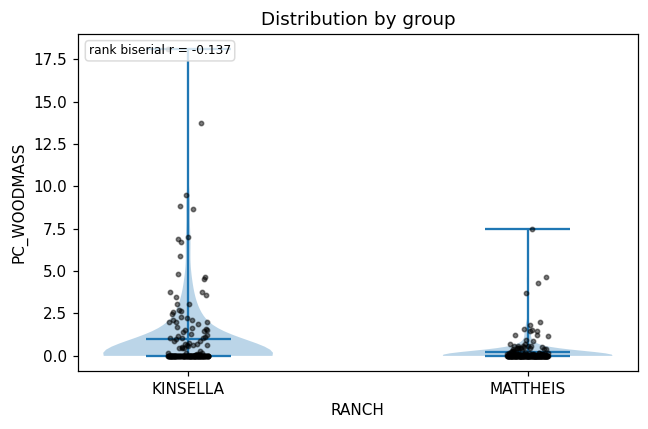
example_classification.csv
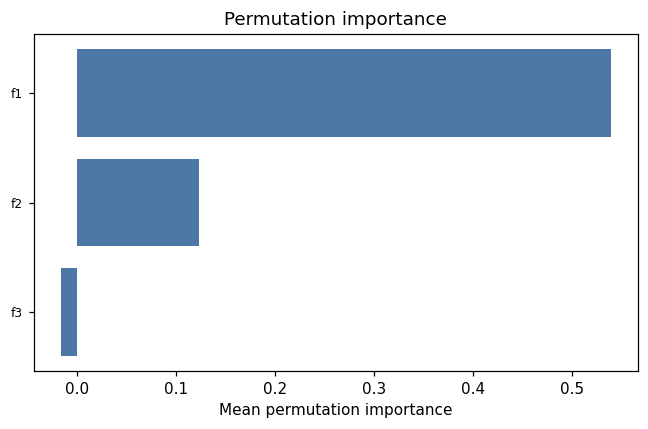
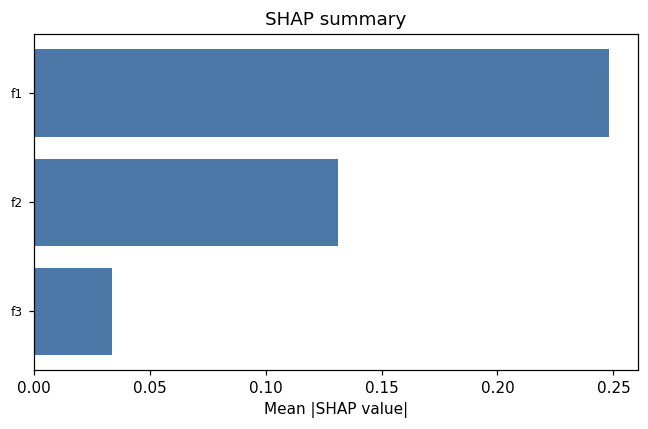
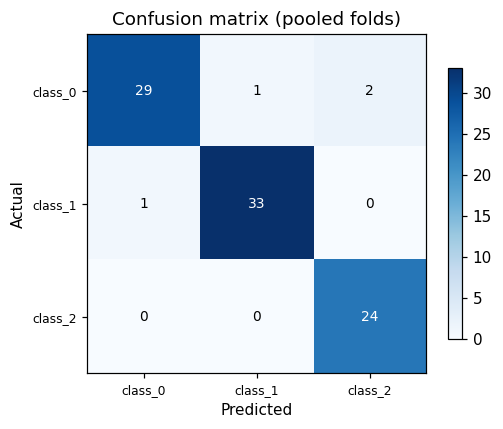
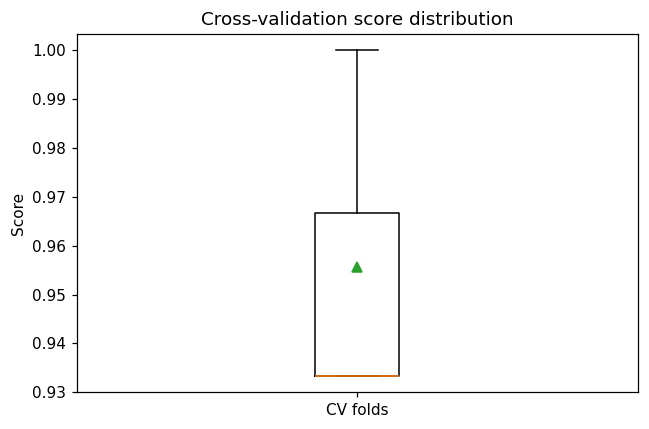
Random Forest classification
ok 6.5s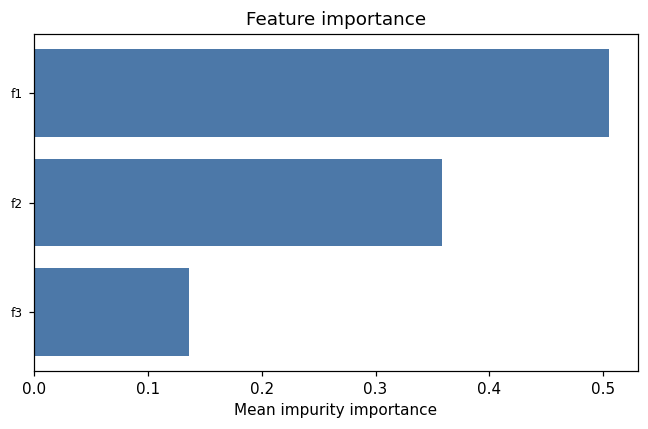
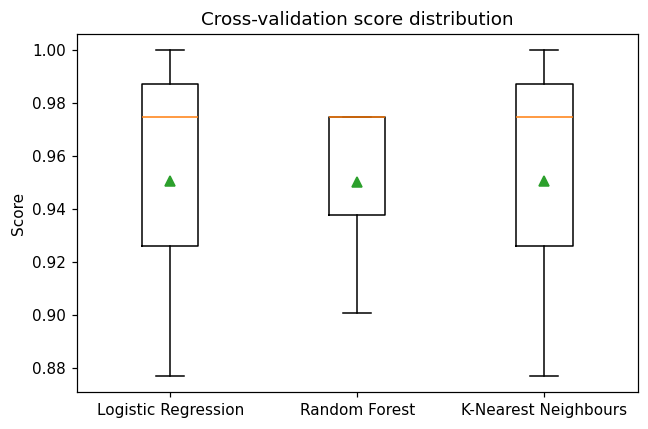
Model comparison (classification)
ok 4.8s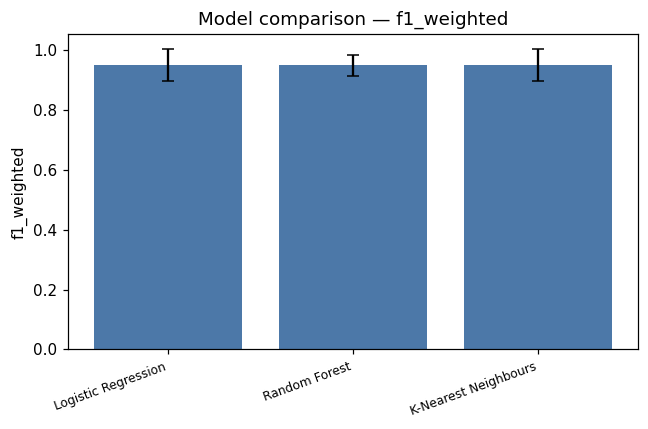
example_posthoc.csv
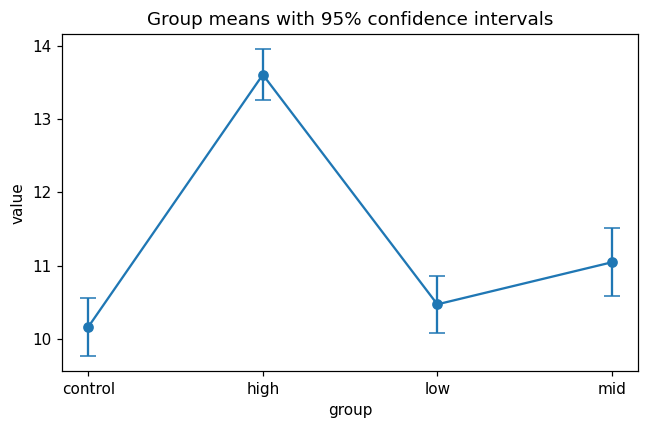
ANOVA + Tukey post-hoc
ok 2.9s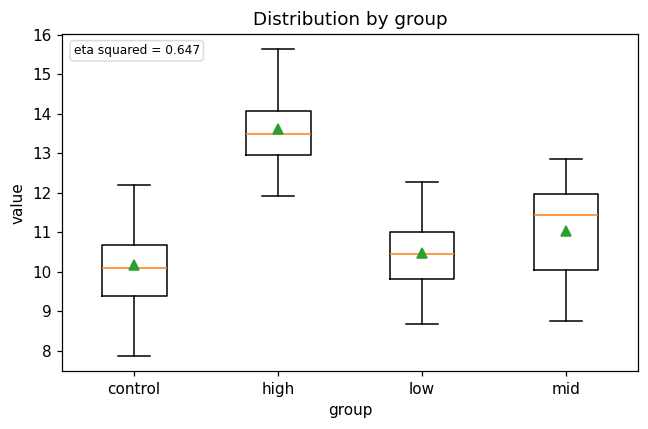
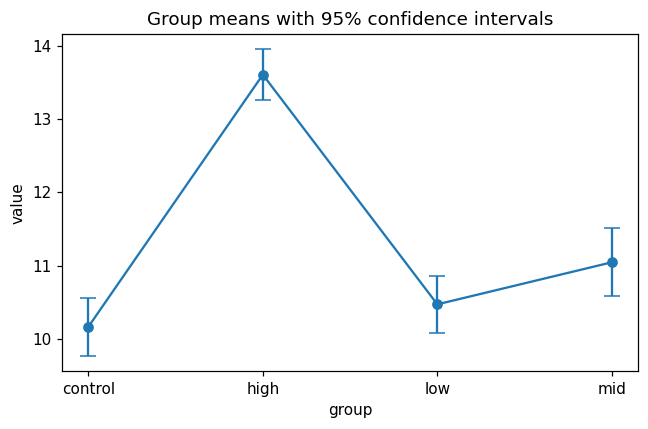
Kruskal-Wallis + Dunn post-hoc
ok 2.9s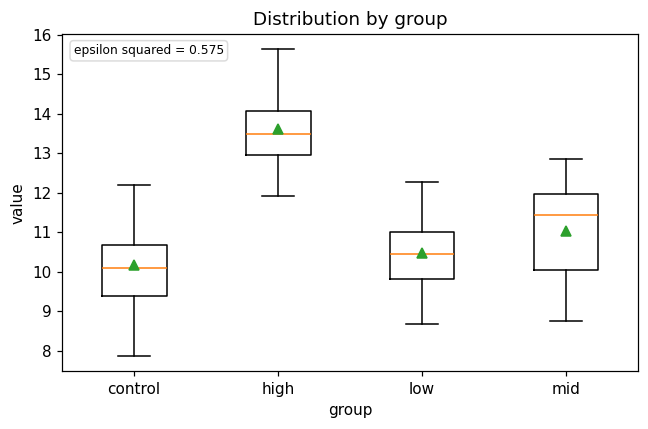
example_posthoc_two_groups.csv
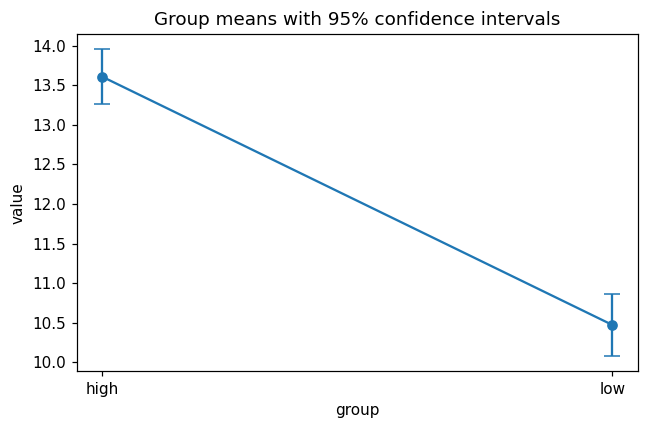
t-Test (two groups)
ok 2.4s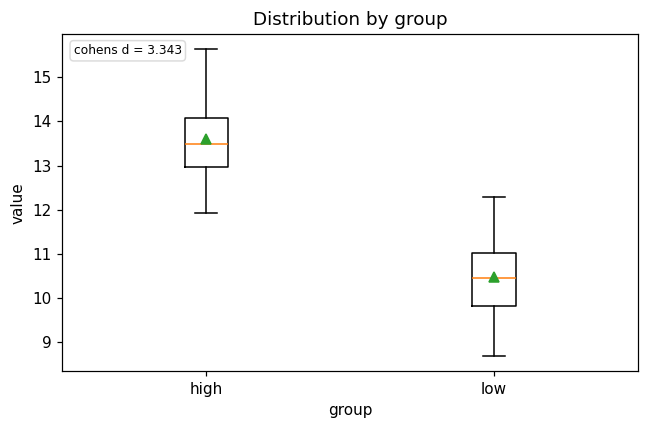
Mann-Whitney U
ok 3.0s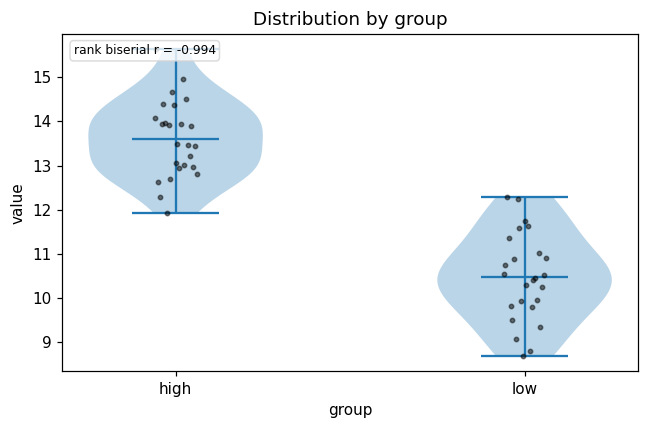
example_lmm.csv
Mixed-effects model
ok 3.9s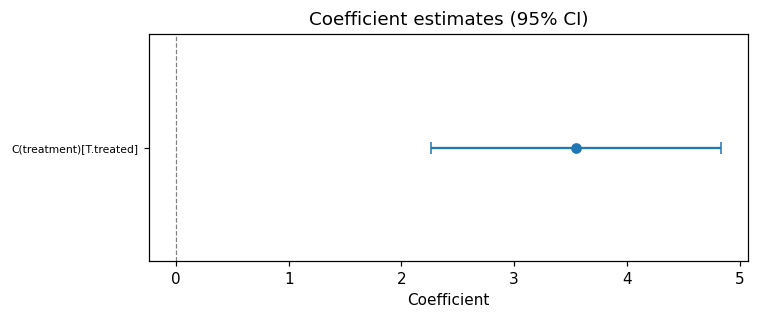
example_glm_counts.csv
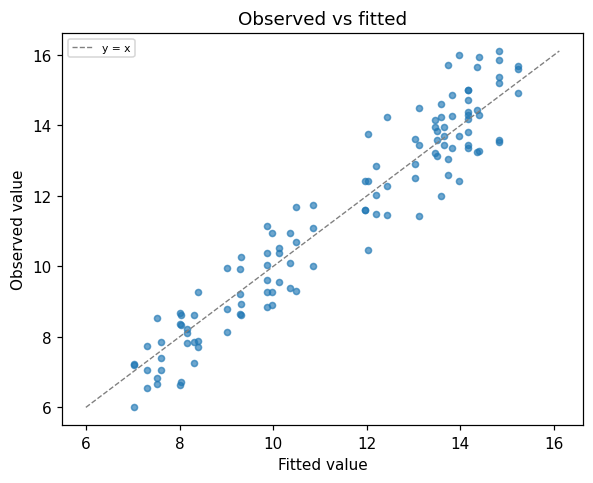
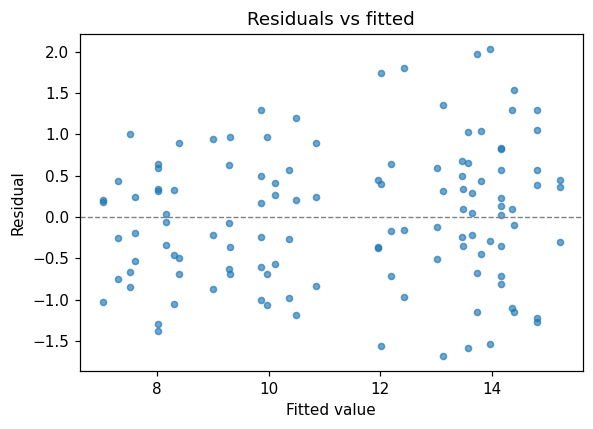
Poisson GLM for counts
ok 3.6s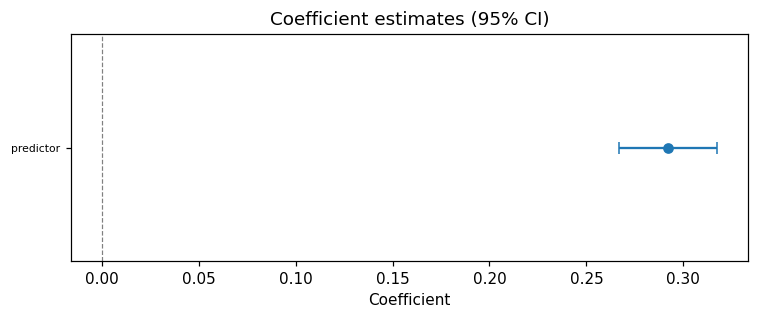
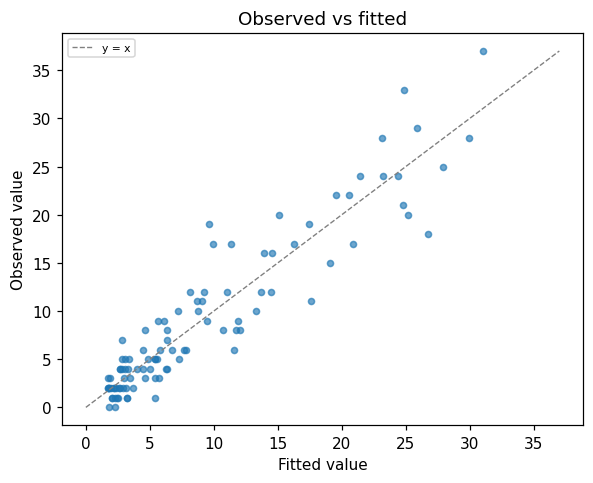
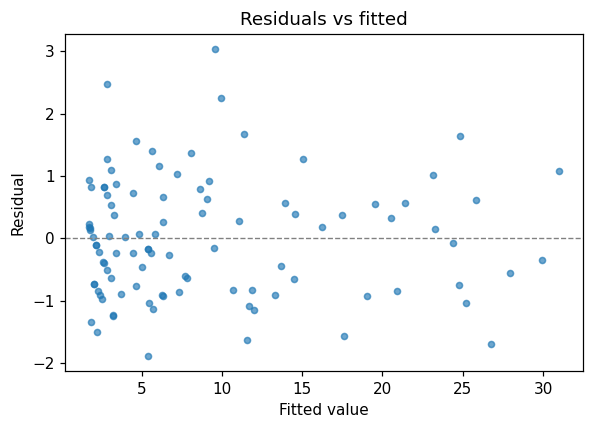
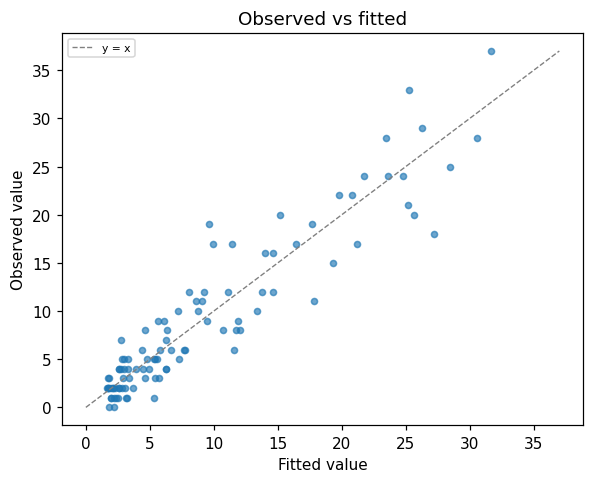
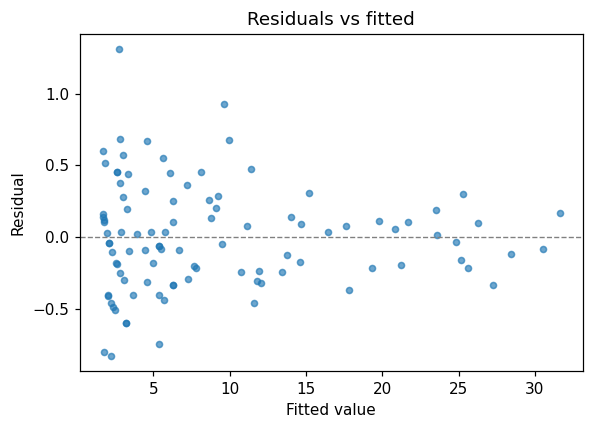
Negative-binomial GLM for counts
ok 4.1s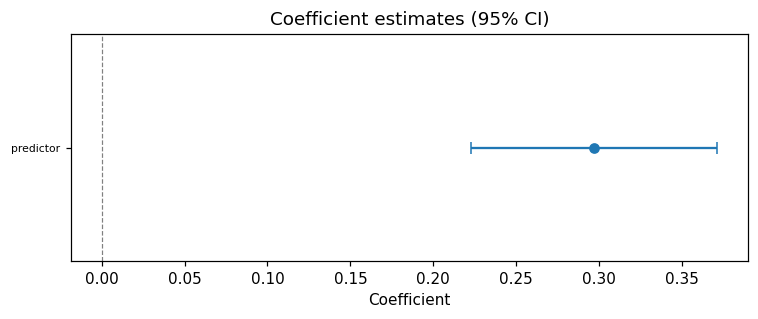
example_repeated_measures.csv
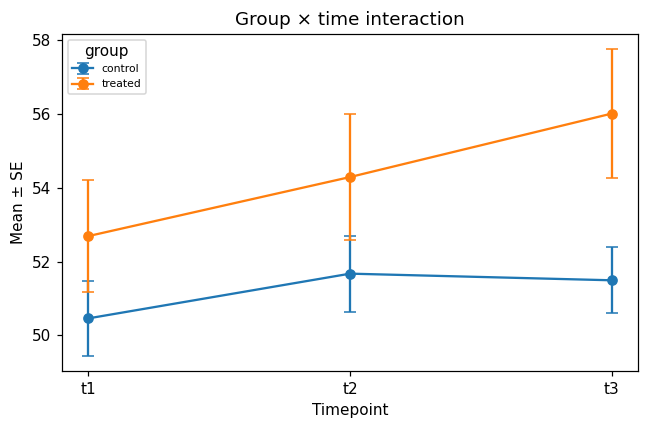
Repeated-measures ANOVA
ok 3.0s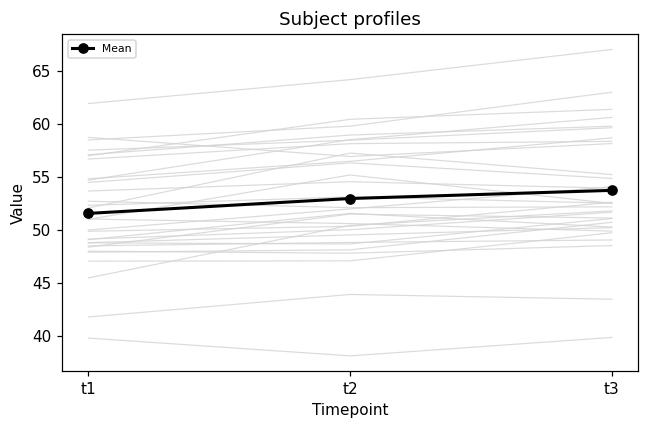
example_ordination.csv
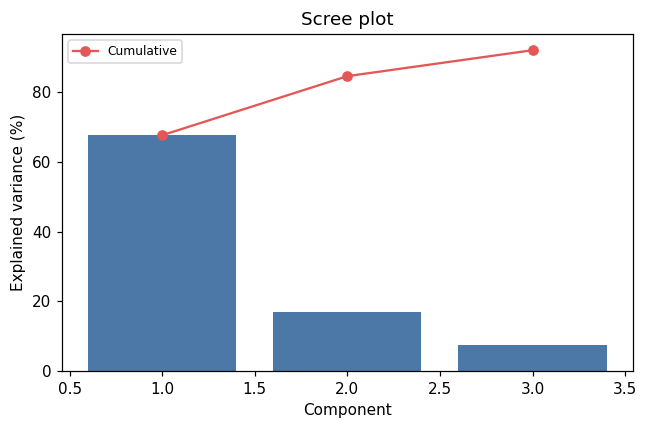
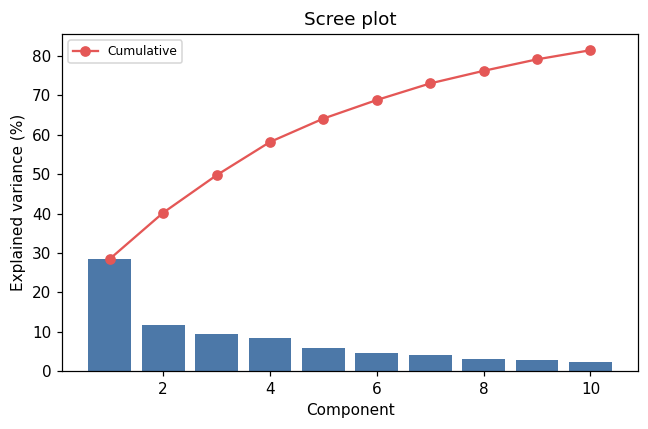
PCA
ok 4.9s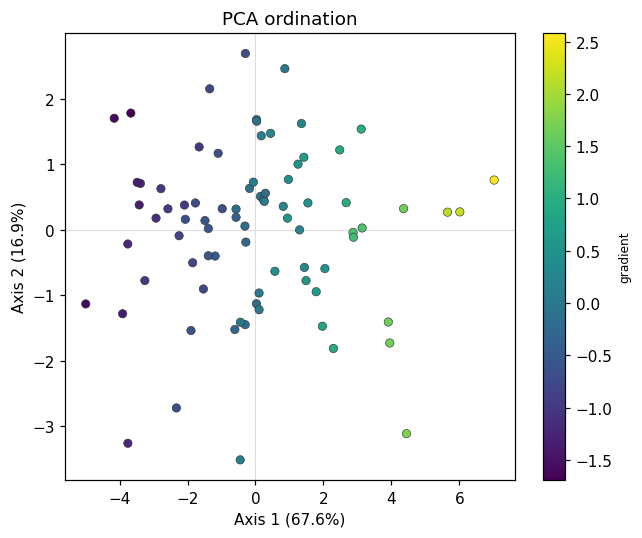
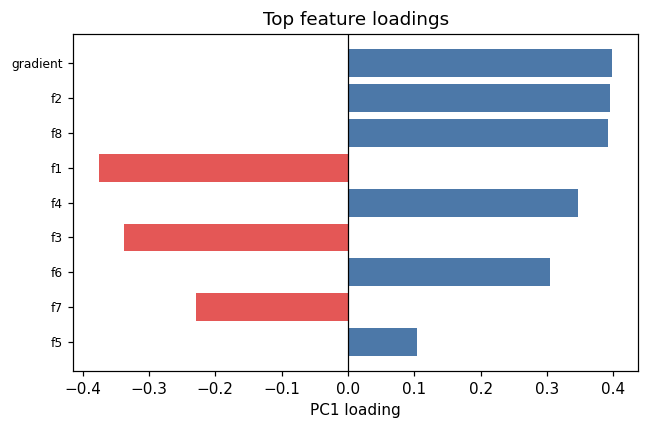
PCoA (Bray-Curtis)
ok 4.1s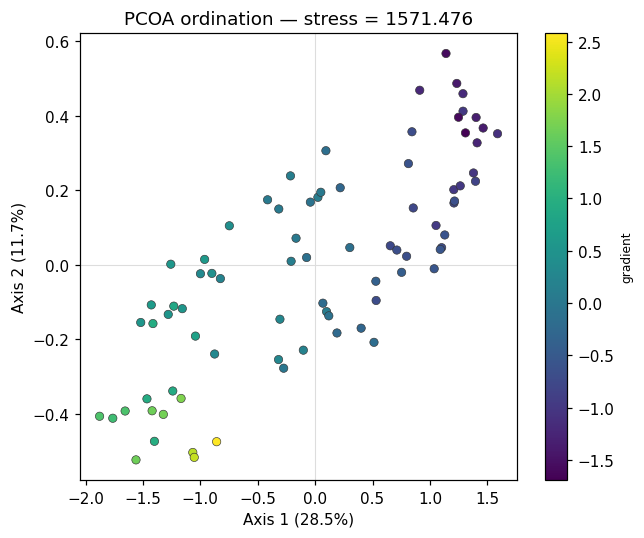
NMDS
ok 3.8s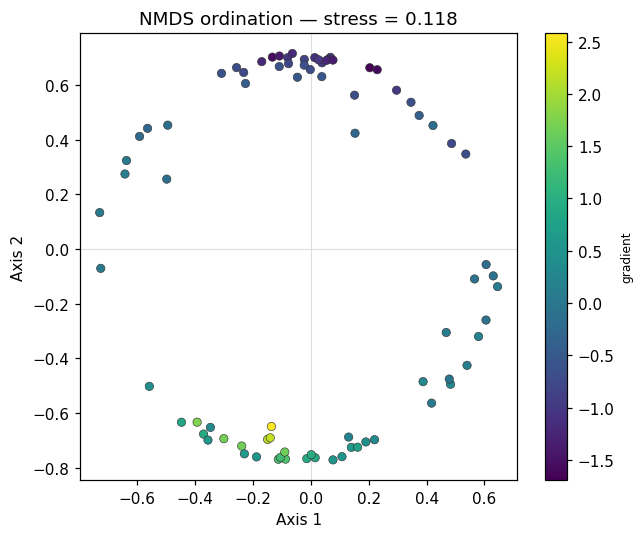
example_clustering.csv
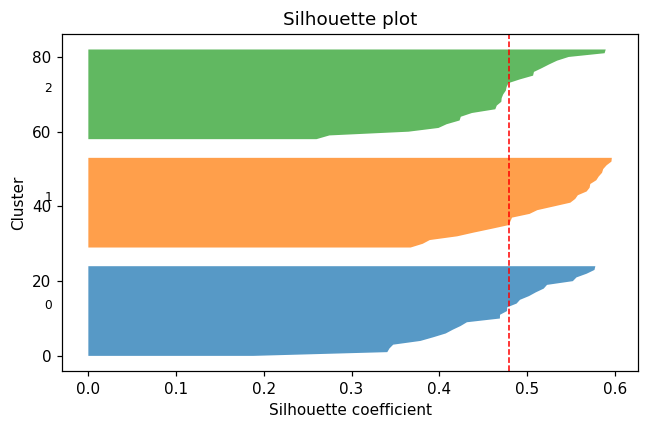
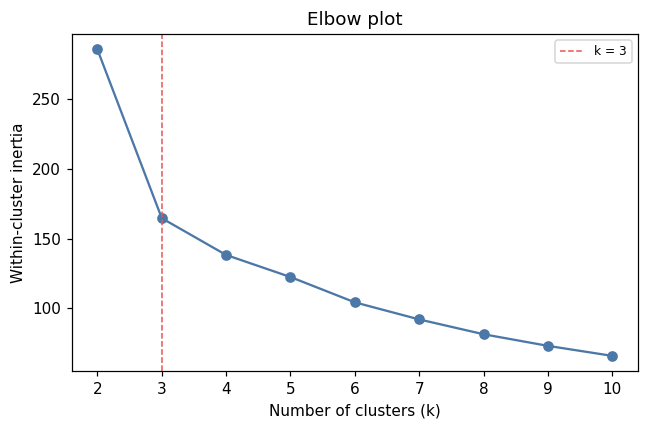
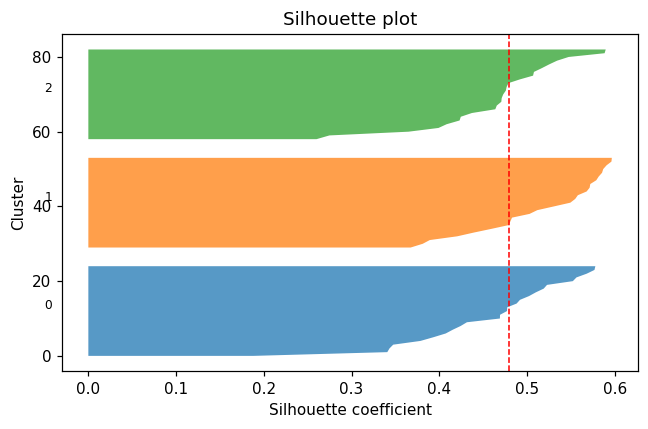
K-means clustering
ok 4.8s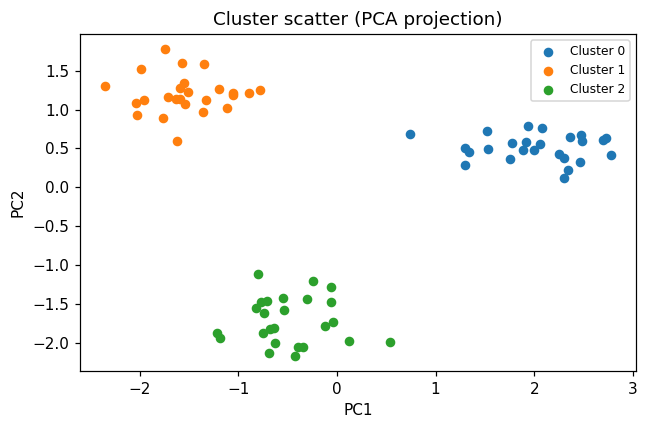
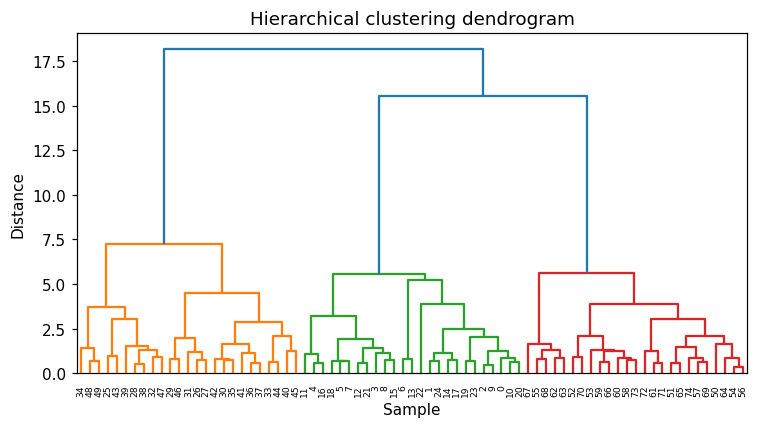
Agglomerative clustering
ok 8.0s
example_community_matrix.csv
Alpha diversity
ok 4.4s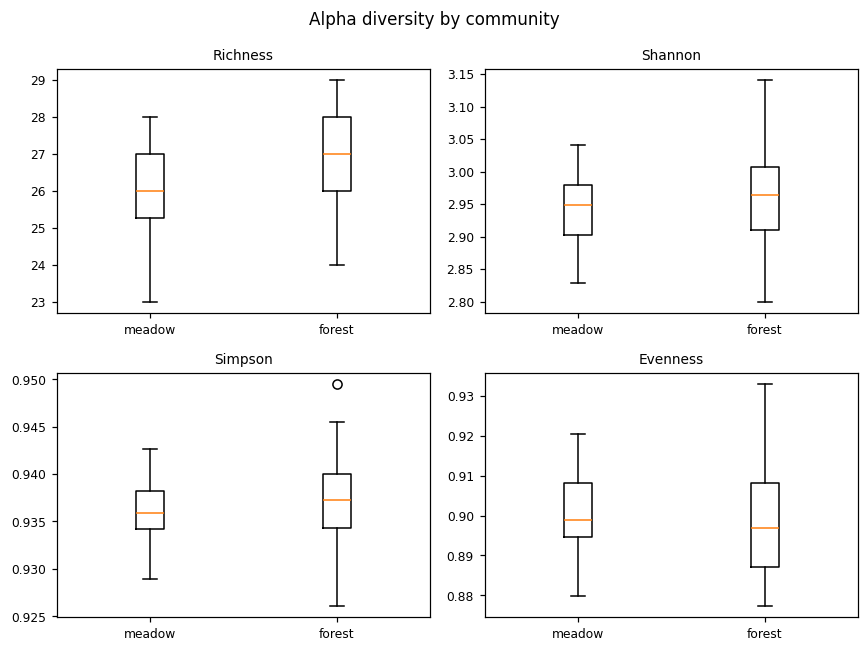
Beta diversity (PERMANOVA)
ok 5.2s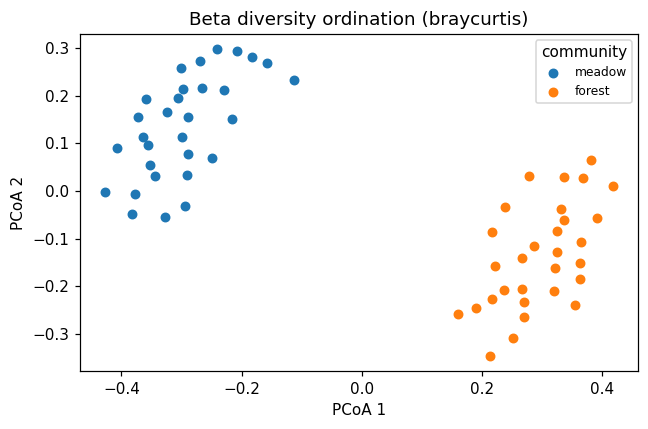
Indicator species
ok 1.9s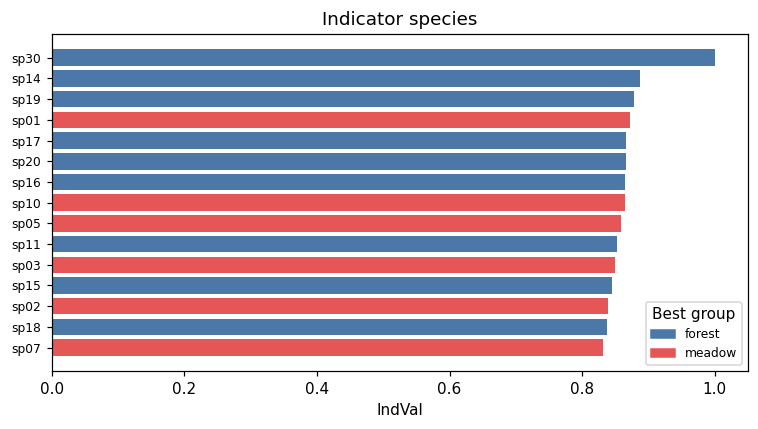
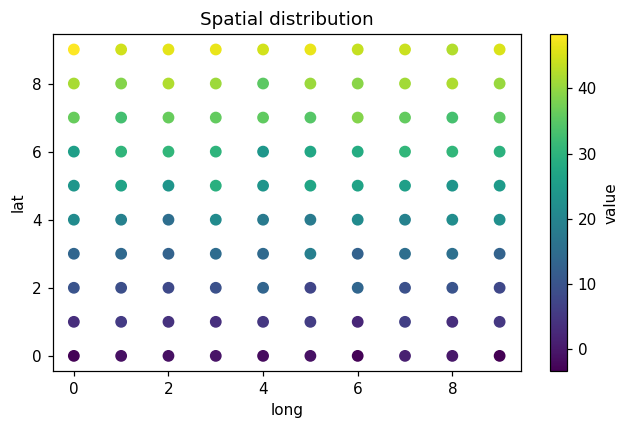
example_spatial.csv
Moran's I spatial autocorrelation
ok 5.6s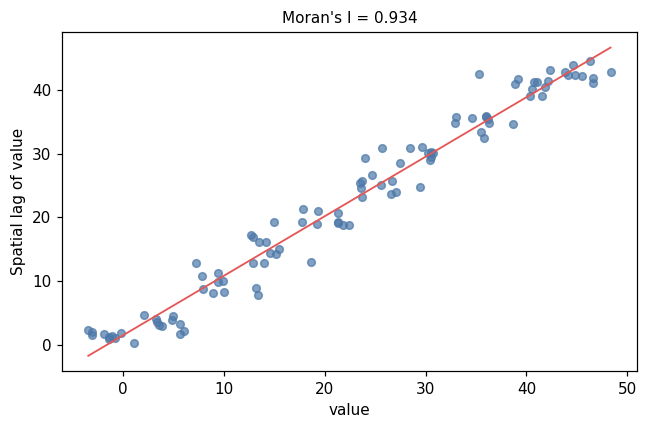
demo_simple.csv
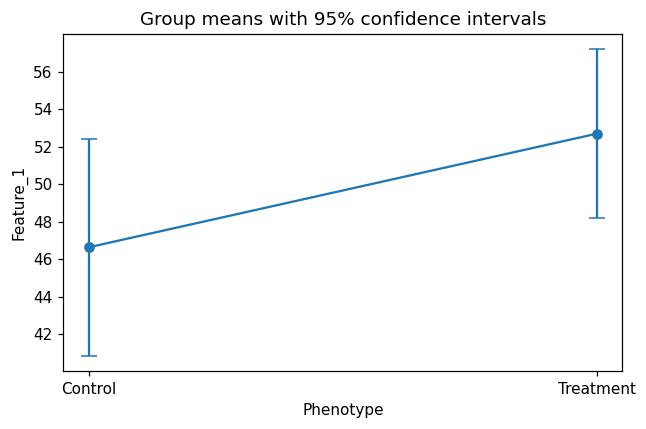
t-Test — Phenotype groups
ok 2.8s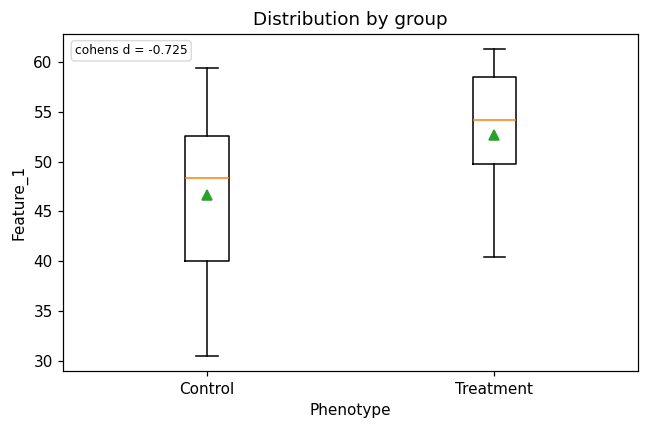
example_proteomics.csv
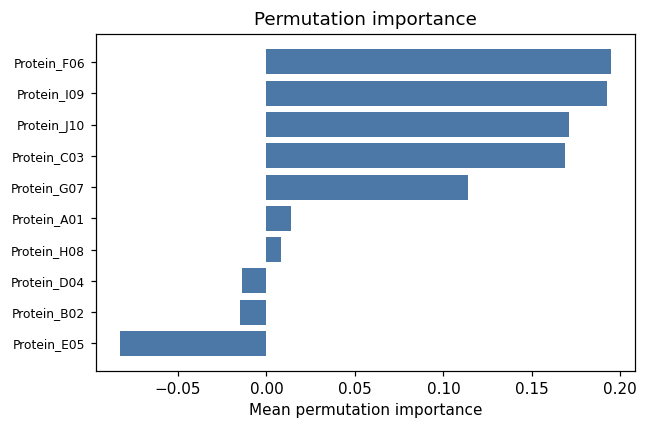
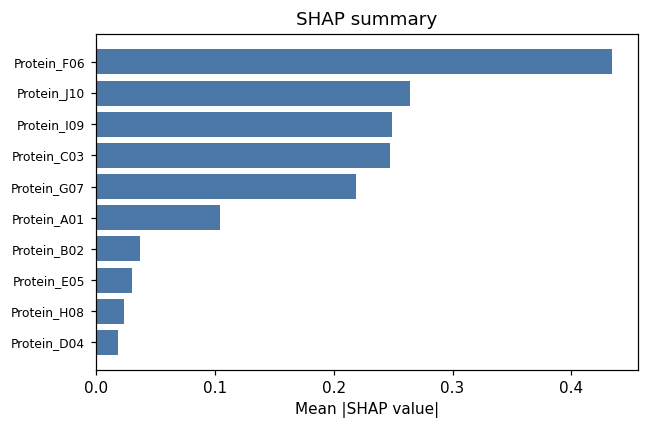
Random Forest — protein content
ok 9.4s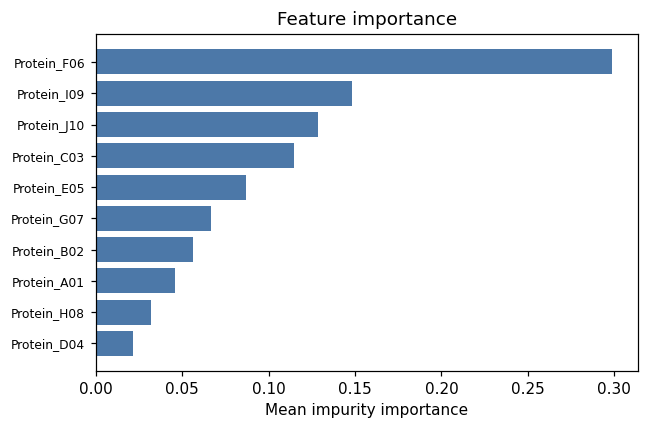
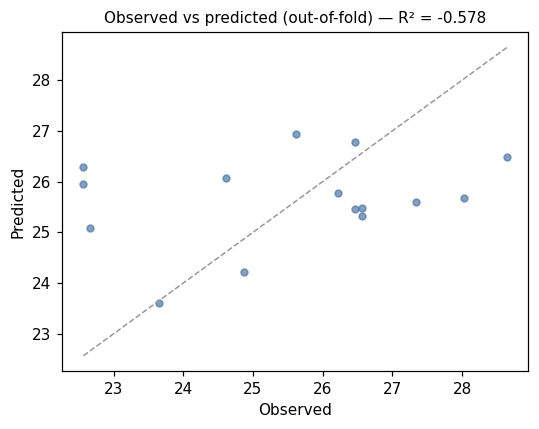
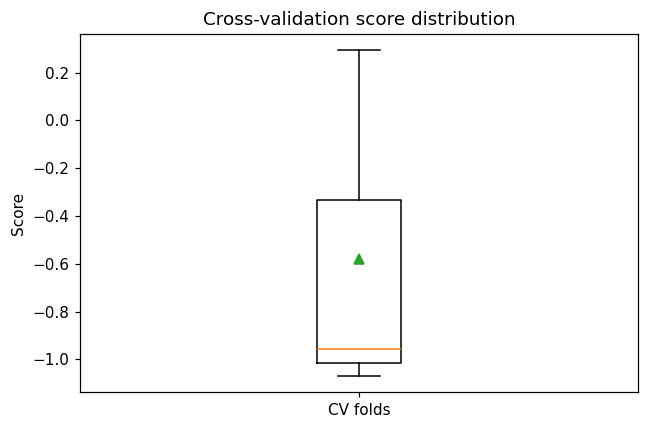
Pathway enrichment (all ORA) — Arabidopsis flowering-time genes
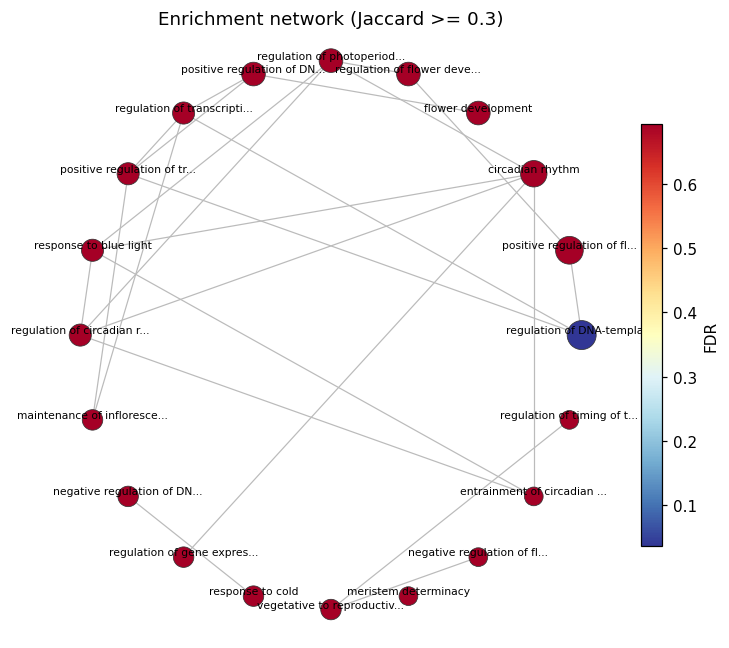
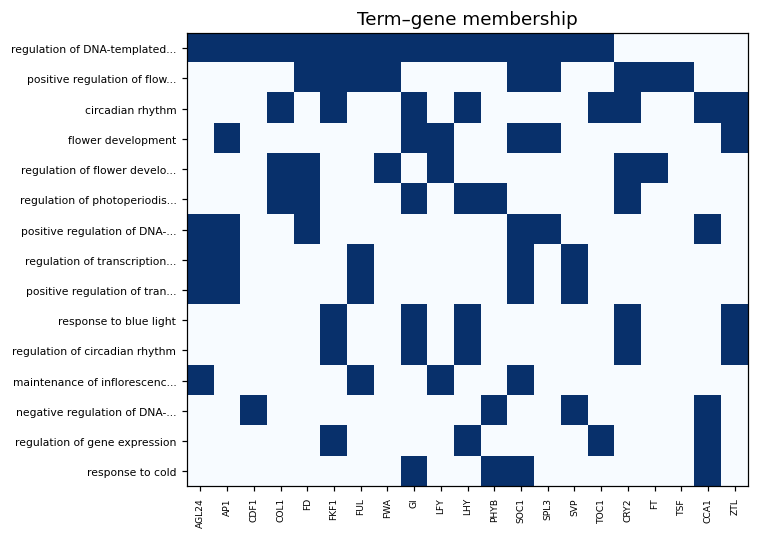
ok 7.9sThe proteomics feature names are synthetic and cannot map to real gene annotations, so this entry submits a manual list of Arabidopsis flowering-time/circadian genes (organism arabidopsis) — a known-enrichable set exercising the live mygene.info + KEGG + Reactome pipeline end-to-end.
example_metabolomics.csv
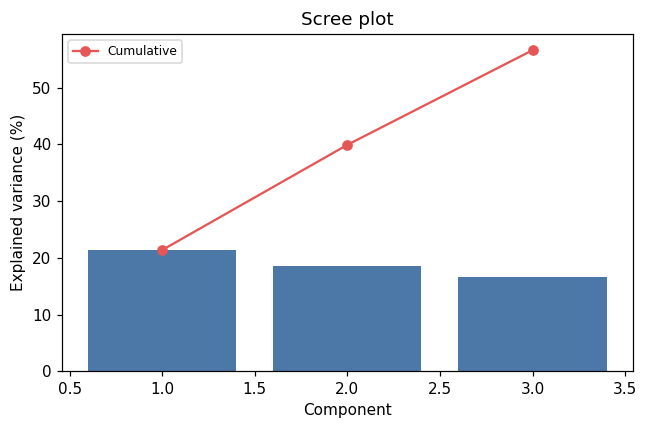
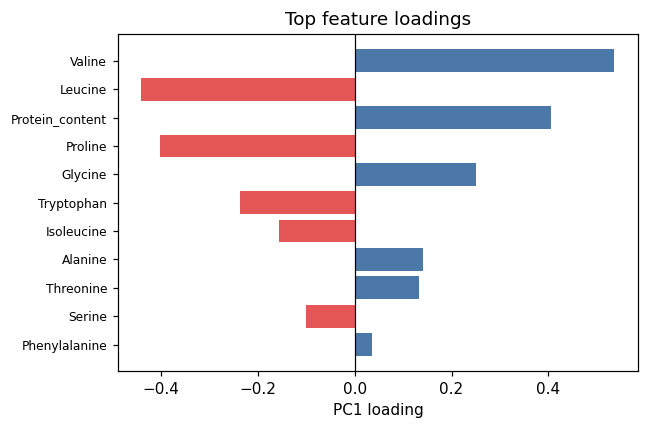
PCA — metabolomics
ok 4.6s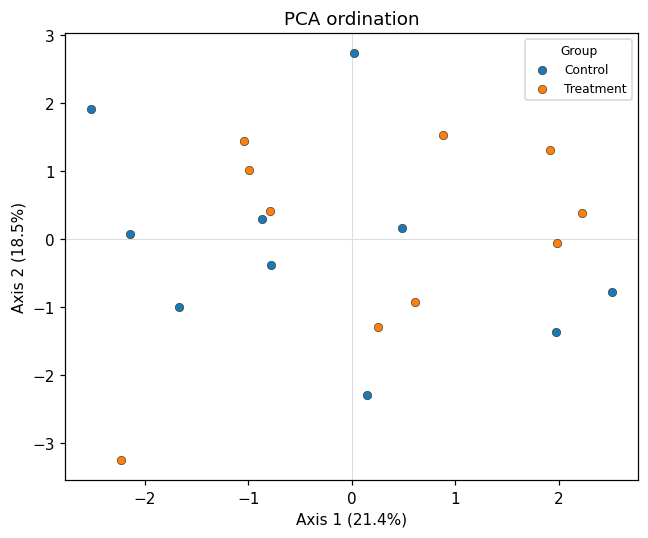
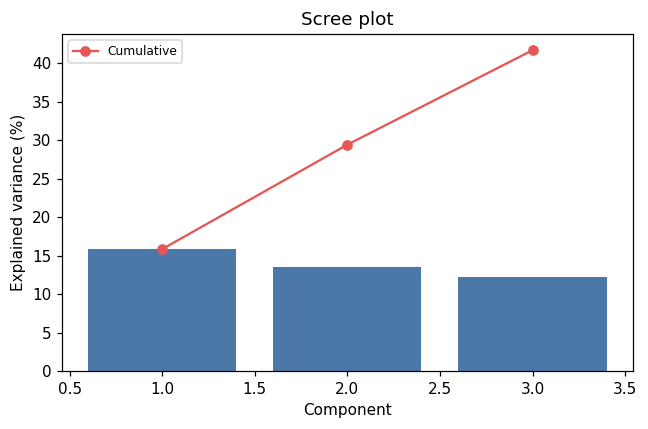
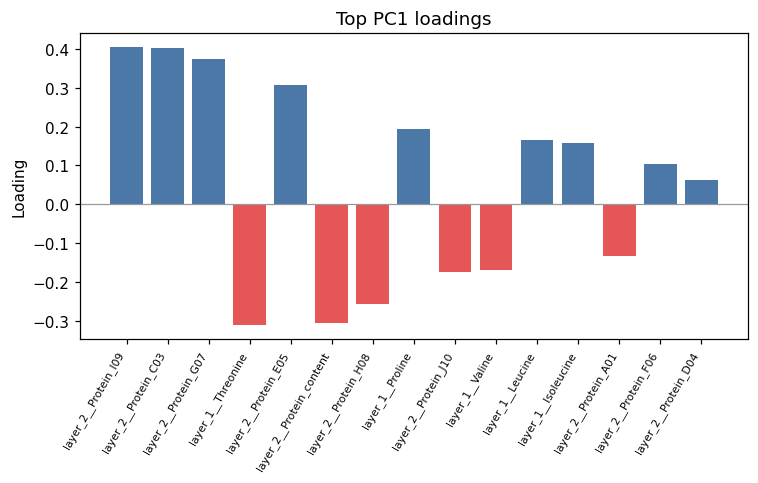
Multi-omics PCA (metabolomics + proteomics)
ok 5.2s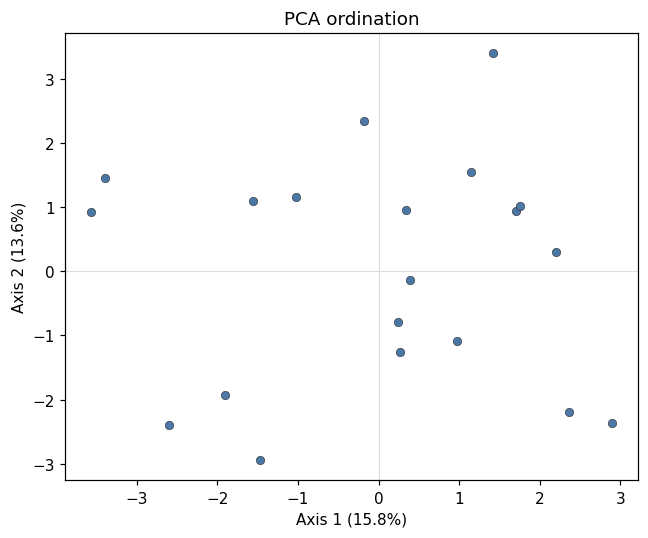
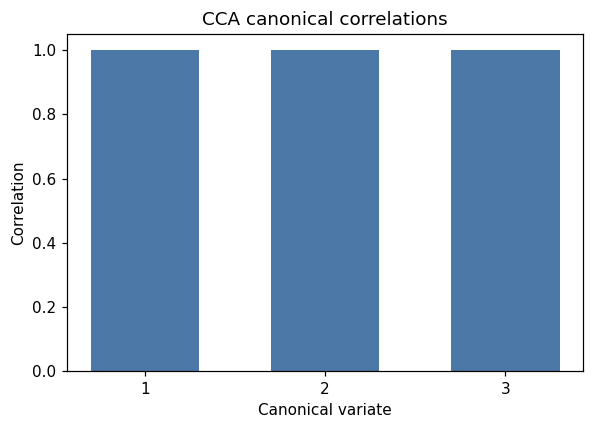
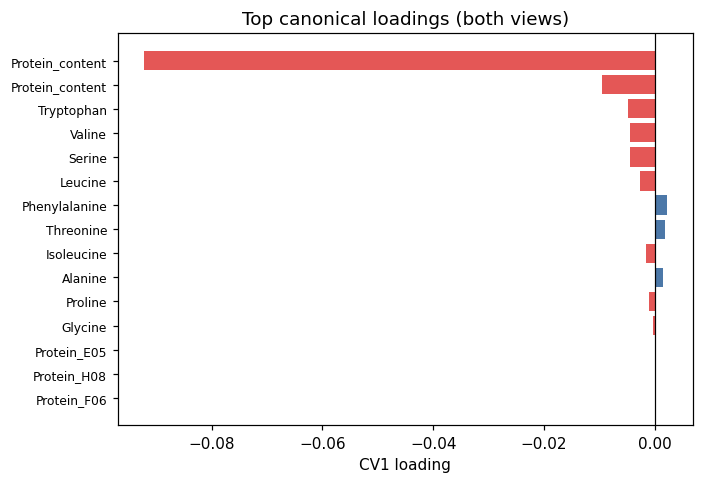
Multi-omics CCA (metabolomics + proteomics)
ok 4.1s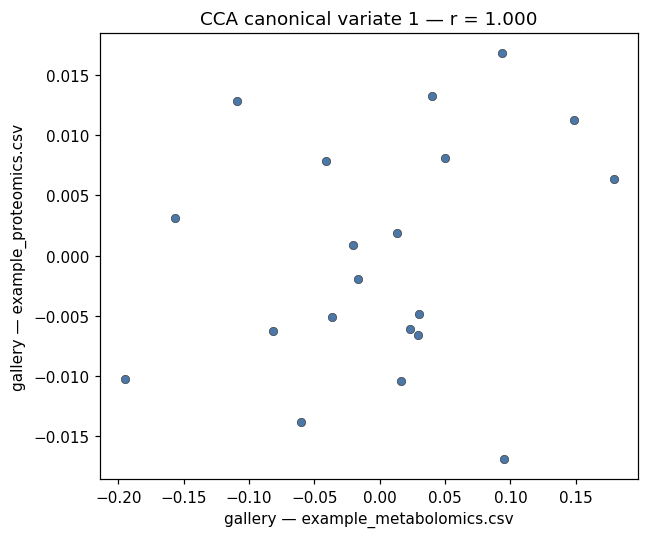
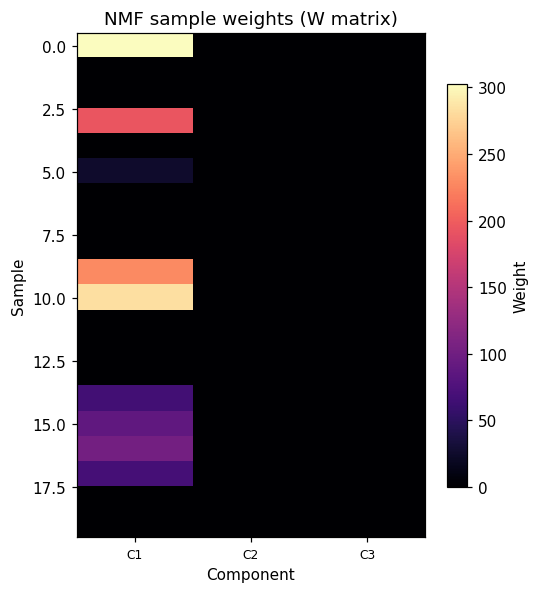
Multi-omics NMF (metabolomics + proteomics)
ok 4.0s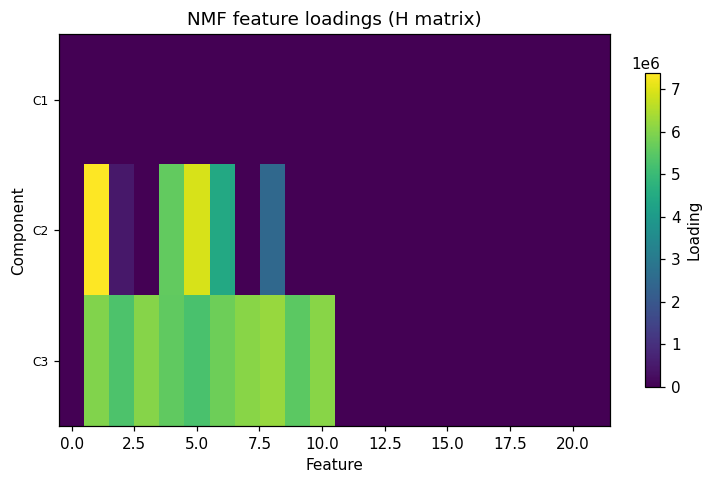
SNF sample networks (metabolomics + proteomics)
ok 1.8s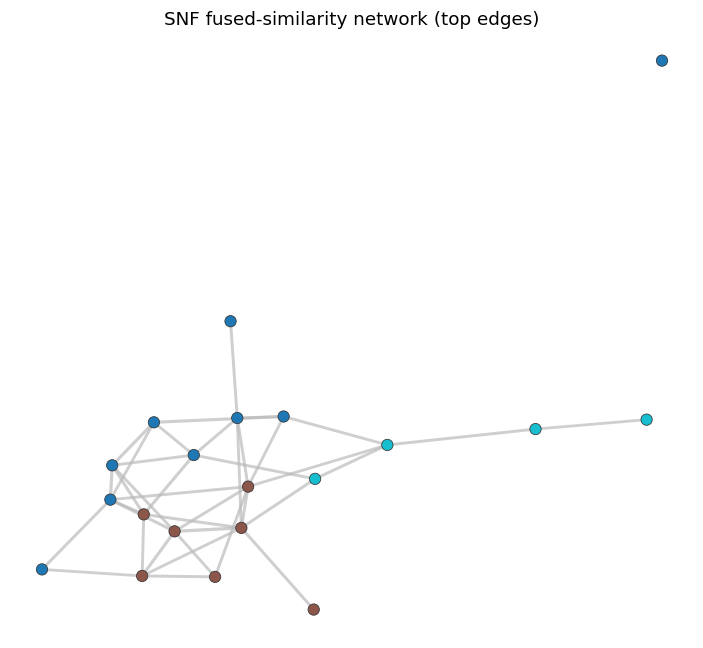
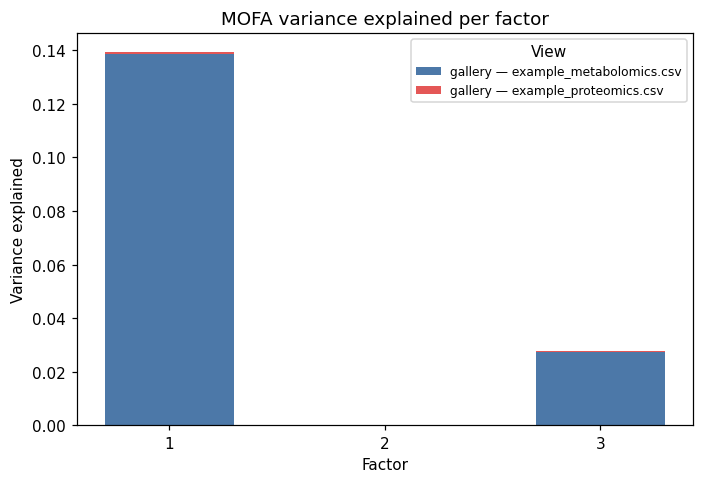
MOFA2 (metabolomics + proteomics)
ok 3.4s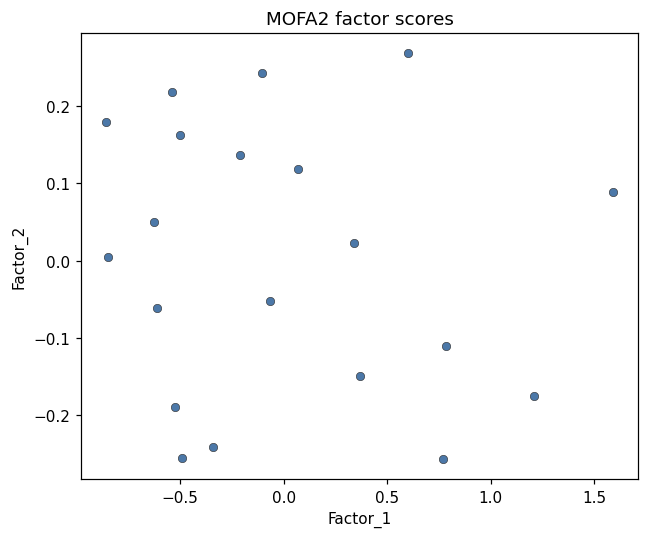
cat_g_metabolomics_subset.csv
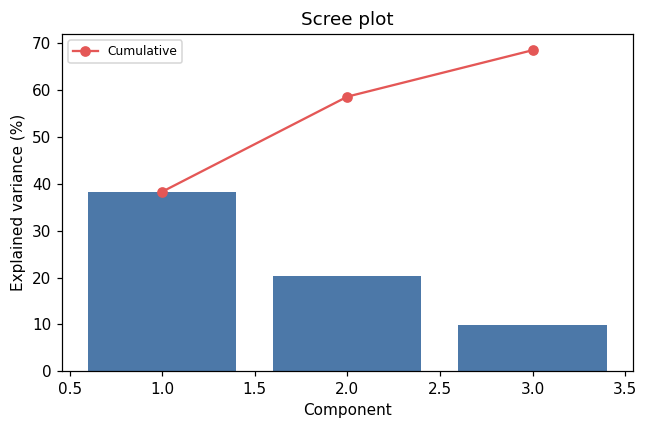
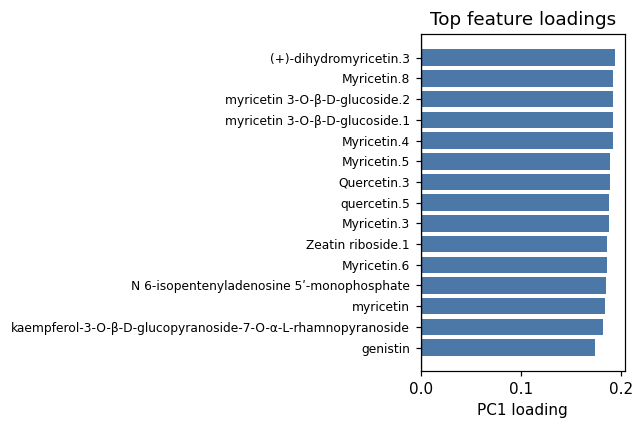
PCA — Cat-G metabolomics subset
ok 5.6s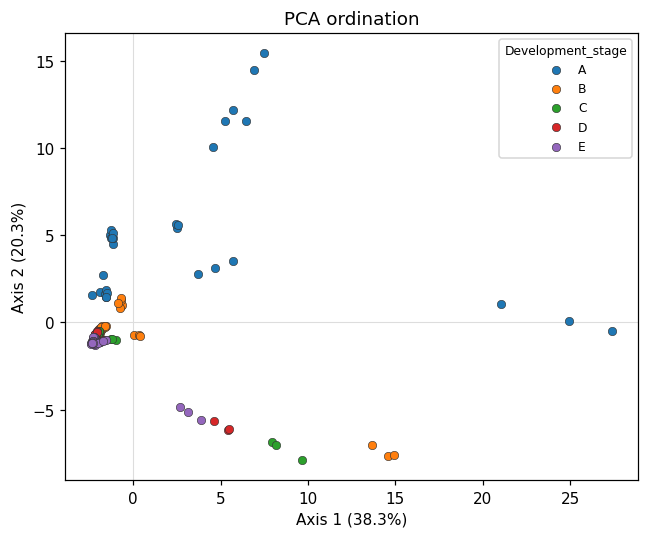
cat_g_proteomics_omics_only.csv
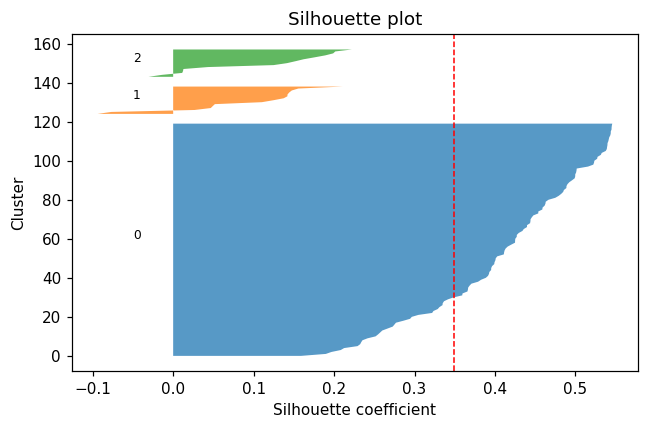
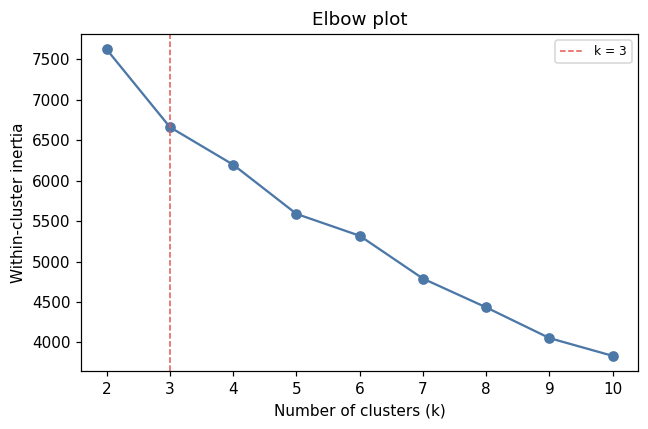
K-means clustering — proteomics
ok 5.7s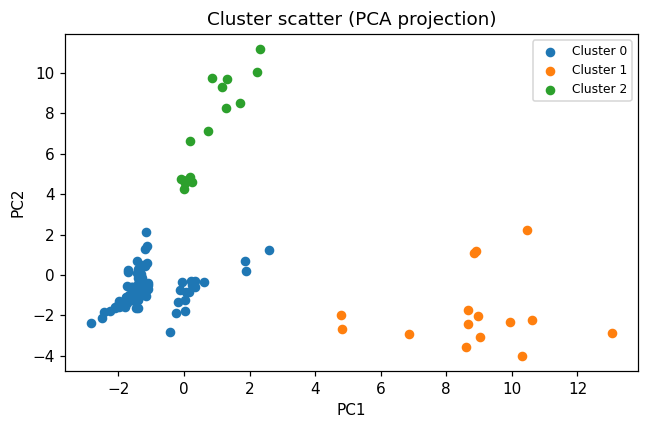
example_gwas.csv
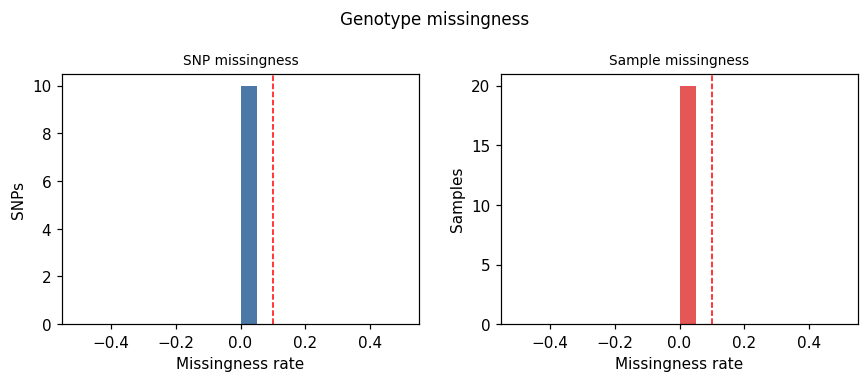
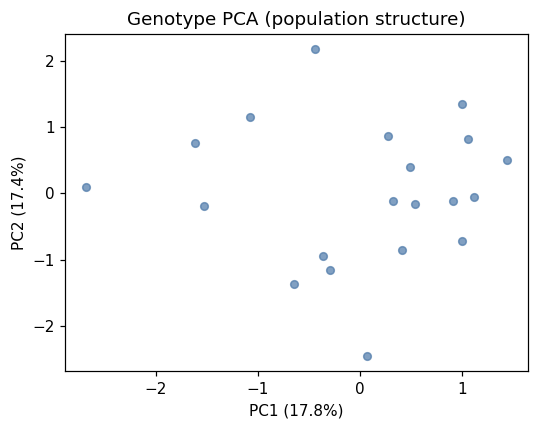
GWAS — trait association
ok 6.8s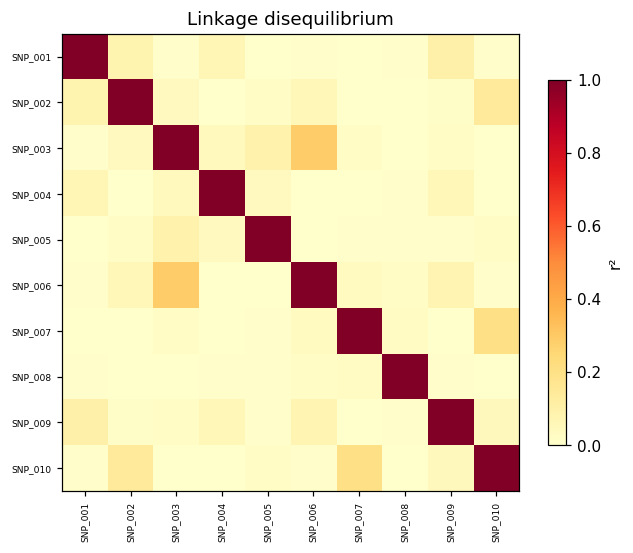
example_gwas_protein.csv
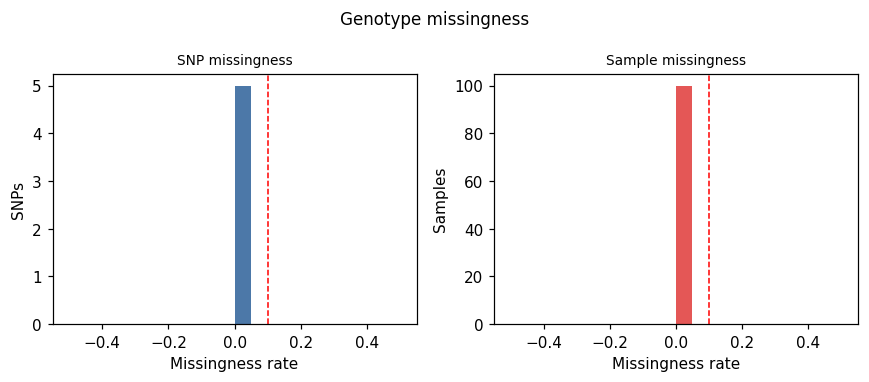
GWAS — protein content
ok 2.8sEdge-case demo: this tiny panel intentionally exercises the QC funnel — most SNPs are filtered by MAF/HWE thresholds, showing how the pipeline reports a degenerate result transparently. See the real-genotypes GWAS entry for a representative run.
cat_g_gwas_real_data.csv
GWAS — protein content (real genotypes)
ok 7.1s