CCA Results
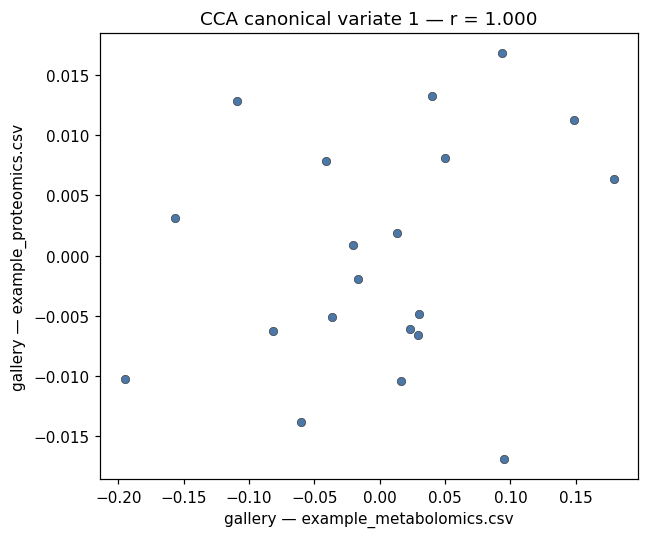
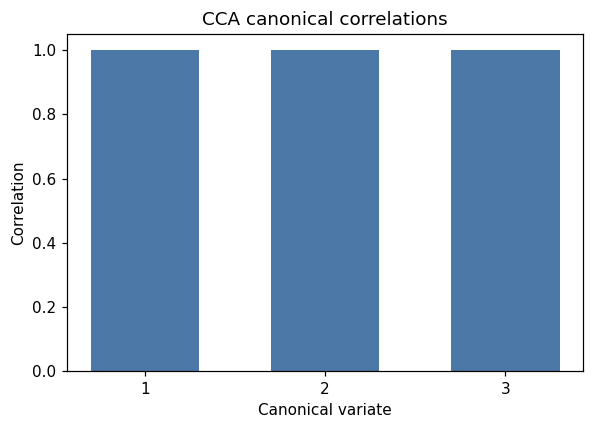
All canonical correlations are at or near 1.0. With 20 samples and 3 components the model is almost certainly overfit; interpret the correlations as a description of this dataset only, not as evidence of real cross-omics structure.
Canonical correlations
| Variate | Correlation |
|---|
| CV1 | 1.0000 |
| CV2 | 1.0000 |
| CV3 | 1.0000 |
gallery — example_metabolomics.csv canonical loadings
gallery — example_proteomics.csv canonical loadings
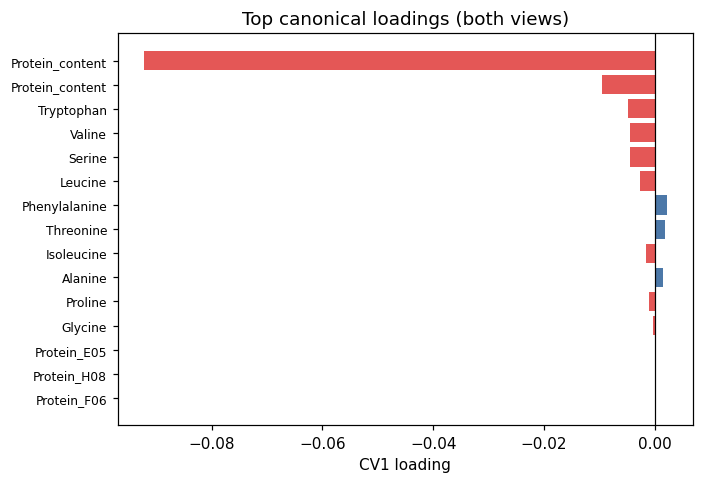
gallery — example_metabolomics.csv — top CV1 loadings
| Feature | CV1 loading |
|---|
| Protein_content | -0.0922 |
| Tryptophan | -0.0048 |
| Valine | -0.0046 |
| Serine | -0.0046 |
| Leucine | -0.0027 |
| Phenylalanine | 0.0021 |
| Threonine | 0.0017 |
| Isoleucine | -0.0016 |
| Alanine | 0.0014 |
| Proline | -0.0011 |
| Glycine | -0.0003 |
gallery — example_proteomics.csv — top CV1 loadings
| Feature | CV1 loading |
|---|
| Protein_content | -0.0095 |
| Protein_E05 | 0.0000 |
| Protein_H08 | 0.0000 |
| Protein_F06 | -0.0000 |
| Protein_A01 | 0.0000 |
| Protein_D04 | 0.0000 |
| Protein_C03 | -0.0000 |
| Protein_I09 | -0.0000 |
| Protein_J10 | -0.0000 |
| Protein_G07 | 0.0000 |
| Protein_B02 | -0.0000 |