Result Detail – T Test
Result Information
- Result ID
- 193
- Type
- T Test
- Status
- completed
- Dataset ID
- 718
- Created
- 2026-09-21 02:17:43.297810
Statistical Test Result
- Test
- t test — Student's t-test (equal variances assumed)
- Statistic
- -1.6206
- p-value
- 0.1225
- Interpretation
- not significant Not significant at alpha=0.05 (p=0.1225).
- Value Column
- Feature_1
- Group Column
- Phenotype
- Groups
- Control (n=10) Treatment (n=10)
- Effect size
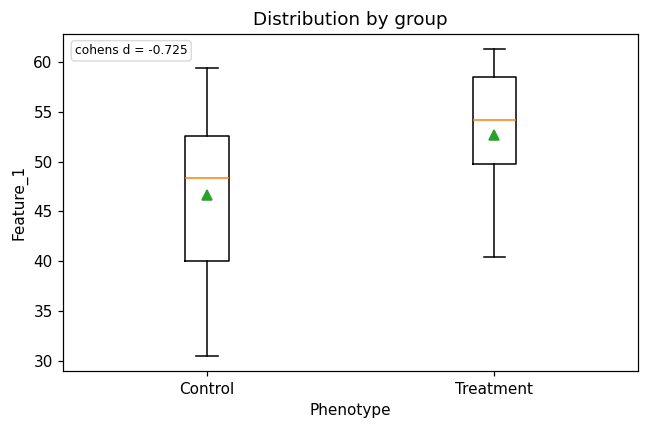
- cohens d = -0.7247
Assumptions
- Shapiro-Wilk, group Control: W=0.9677, p=0.8688 — normal
- Shapiro-Wilk, group Treatment: W=0.8998, p=0.2179 — normal
- Levene's test (equal variances): p=0.3675
Group descriptives
| Group | n | Mean | SD | Median | Min | Max |
|---|---|---|---|---|---|---|
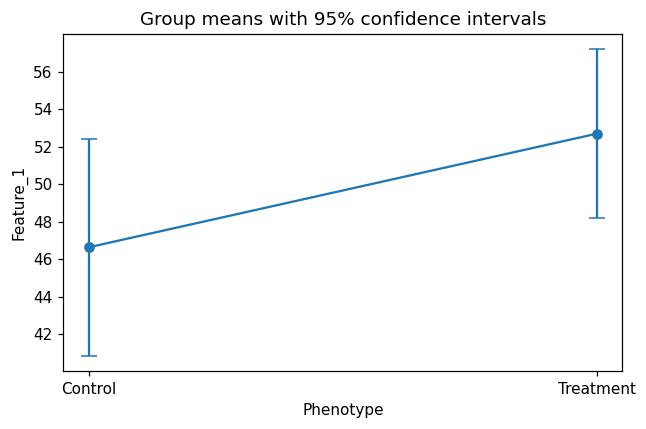
| Control | 10 | 46.6443 | 9.3349 | 48.3348 | 30.4896 | 59.4056 |
| Treatment | 10 | 52.6971 | 7.2361 | 54.1813 | 40.4112 | 61.2724 |
Interactive group boxplot
Figures
Distribution by group — cohens d = -0.725
Download PNG
Group means (95% CI)
Download PNG
Pathway Analysis (same dataset)
Method & Provenance
- Method
- Student's / Welch's t-test
- Method key
t_test(result type:statistical_test, result #193)- Engine
- Python · scipy v1.17.1
- Dataset(s)
- #718 gallery — demo_simple.csv
- Status
- completed
- Permanent link
- https://cat-g-omxpert.wishartlab.com/results/by-token/d1b299470a2b4e1993972286fbf0145f Bookmark or share this URL — it does not depend on your session.
- Created
- 2026-09-21 02:17:43.297810
Parameters used
| Parameter | Value |
|---|---|
test_type | independent |
value_col | Feature_1 |
group_col | Phenotype |
Execution trace
Reconstructed from the parameters stored with this result — represents the Python/R calls the analysis service made.
from scipy import statsstat, p = stats.ttest_ind(group_a, group_b, equal_var=<levene>)