Result Detail – Anova
Result Information
- Result ID
- 184
- Type
- Anova
- Status
- completed
- Dataset ID
- 705
- Created
- 2026-09-21 02:16:35.150878
Statistical Test Result
- Test
- anova
- Statistic
- 58.7757
- p-value
- 1.172e-21
- Interpretation
- significant Significant at alpha=0.05 (p=1.172e-21).
- Value Column
- value
- Group Column
- group
- Groups
- control (n=25) high (n=25) low (n=25) mid (n=25)
- Effect size
- eta squared = 0.6475
Assumptions
- Shapiro-Wilk, group control: W=0.9645, p=0.51 — normal
- Shapiro-Wilk, group high: W=0.9855, p=0.9688 — normal
- Shapiro-Wilk, group low: W=0.9784, p=0.8518 — normal
- Shapiro-Wilk, group mid: W=0.9481, p=0.2275 — normal
- Levene's test (equal variances): p=0.5163
Group descriptives
| Group | n | Mean | SD | Median | Min | Max |
|---|---|---|---|---|---|---|
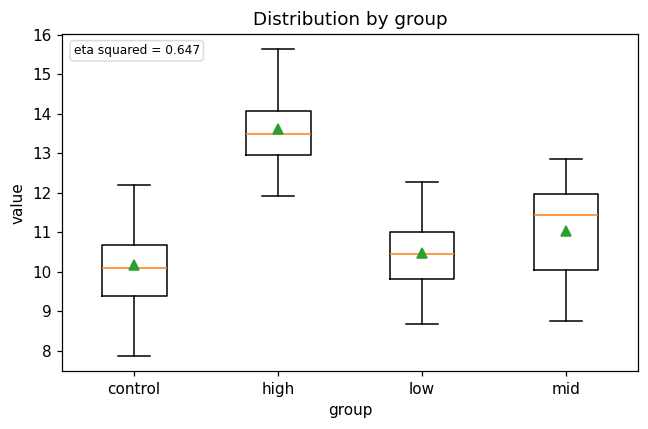
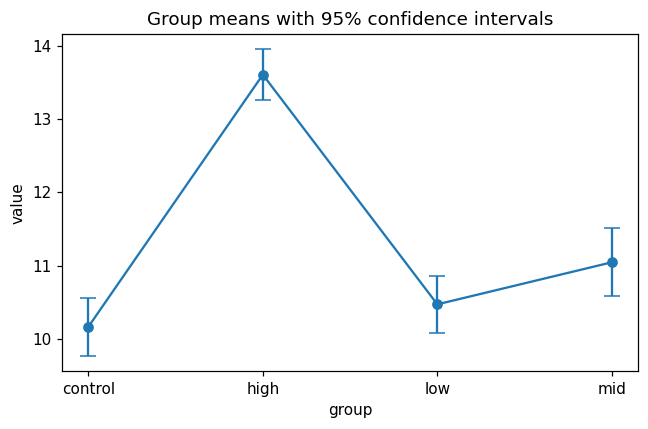
| control | 25 | 10.1641 | 1.0121 | 10.0977 | 7.8761 | 12.1898 |
| high | 25 | 13.6068 | 0.8771 | 13.4861 | 11.9326 | 15.6286 |
| low | 25 | 10.4711 | 0.9953 | 10.4470 | 8.6869 | 12.2762 |
| mid | 25 | 11.0452 | 1.1794 | 11.4454 | 8.7608 | 12.8607 |
Interactive group boxplot
Post-hoc pairwise comparisons tukey hsd
| Group A | Group B | Mean diff | p (adjusted) | Significant |
|---|---|---|---|---|
| control | high | 3.4427 | 0 | yes |
| control | low | 0.3069 | 0.7132 | no |
| control | mid | 0.8810 | 0.0155 | yes |
| high | low | -3.1358 | 0 | yes |
| high | mid | -2.5617 | 0 | yes |
| low | mid | 0.5741 | 0.2002 | no |
Figures
Distribution by group — eta squared = 0.647
Download PNG
Group means (95% CI)
Download PNG
Pathway Analysis (same dataset)
Method & Provenance
- Method
- One-way ANOVA
- Method key
anova(result type:statistical_test, result #184)- Engine
- Python · scipy v1.17.1
- Dataset(s)
- #705 gallery — example_posthoc.csv
- Status
- completed
- Permanent link
- https://cat-g-omxpert.wishartlab.com/results/by-token/85cb34714fa74c32ab5bce84daef7c9a Bookmark or share this URL — it does not depend on your session.
- Created
- 2026-09-21 02:16:35.150878
Parameters used
| Parameter | Value |
|---|---|
test_type | anova |
value_col | value |
group_col | group |
Execution trace
Reconstructed from the parameters stored with this result — represents the Python/R calls the analysis service made.
from scipy import statsstat, p = stats.f_oneway(*groups)