GWAS Result
Target: Protein_Y19 | Encoding: additive | SNPs after QC: 8 / 20 | Samples: 283 | Significant: 0 | λGC: 33.578
Severe test-statistic inflation (λGC = 33.58).
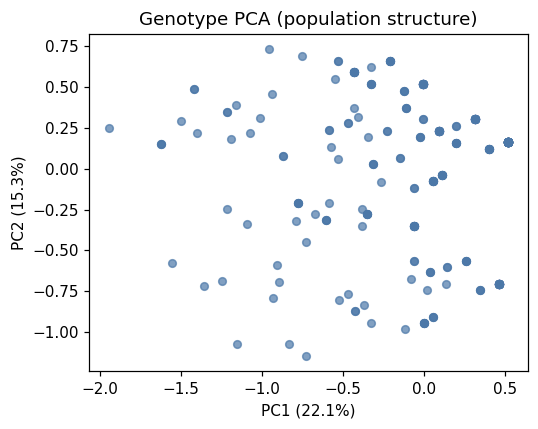
A genomic-control lambda far above 1 usually indicates unaccounted
confounding — population structure, relatedness, or batch effects —
rather than true associations. Treat the association table with caution;
consider including genotype PCs as covariates or a mixed-model
association before interpreting hits.
| Metric | Value |
|---|---|
| n_snps_input | 20 |
| n_snps_after_qc | 8 |
| maf_filtered | 0 |
| missingness_filtered | 0 |
| hwe_filtered | 12 |
| hwe_not_testable | 0 |
| ld_pruned | 0 |
| SNP ▲▼ | Chromosome ▲▼ | Position ▲▼ | Beta ▲▼ | SE ▲▼ | R² ▲▼ | P-value ▲▼ | Corrected P ▲▼ |
|---|---|---|---|---|---|---|---|
| S4LG4_187284667 | -2.8194 | 0.5593 | 0.0829 | 3.95e-01 | 1.00e+00 | ||
| S7LG7_71596041 | -2.0667 | 0.4757 | 0.0629 | 4.61e-01 | 1.00e+00 | ||
| S4LG4_210125587 | -1.8458 | 0.4448 | 0.0577 | 4.81e-01 | 1.00e+00 | ||
| S3LG5_338923390 | -1.7731 | 0.4459 | 0.0533 | 4.99e-01 | 1.00e+00 | ||
| S4LG4_278653805 | -1.9731 | 0.4989 | 0.0527 | 5.01e-01 | 1.00e+00 | ||
| S7LG7_120057282 | -2.0706 | 0.5649 | 0.0456 | 5.32e-01 | 1.00e+00 | ||
| S6LG2_336919472 | -1.8362 | 0.5322 | 0.0406 | 5.56e-01 | 1.00e+00 | ||
| S2LG1_28487681 | -1.7092 | 0.4957 | 0.0406 | 5.56e-01 | 1.00e+00 |
Static figures
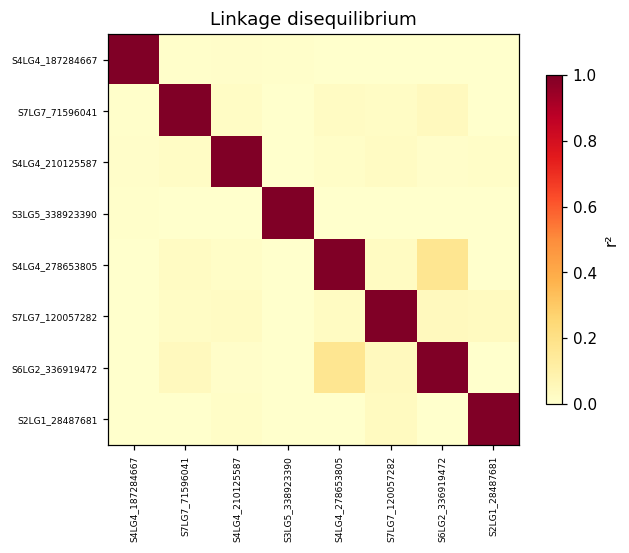
Linkage disequilibrium (r²)
Download PNG
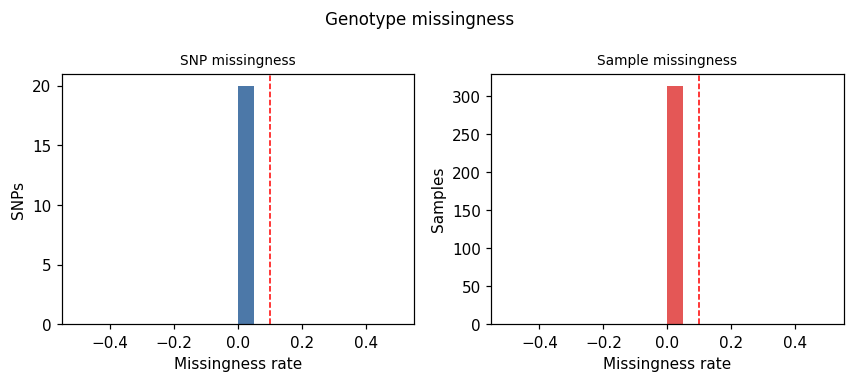
Genotype missingness
Download PNG
Genotype PCA
Download PNG
Method & Provenance
- Method
- GWAS — association analysis
- Method key
gwas(result type:gwas_result, result #29)- Engine
- Python · scikit-learn/statsmodels v1.8.0
- Dataset(s)
- #726 gallery — cat_g_gwas_real_data.csv
- Status
- completed
- Permanent link
- https://cat-g-omxpert.wishartlab.com/results/by-token/bb45ab95d37f40eb83d4d8e3b1980205 Bookmark or share this URL — it does not depend on your session.
- Created
- 2026-09-21 02:18:47.650556
Parameters used
| Parameter | Value |
|---|---|
target_column | Protein_Y19 |
encoding_model | additive |
significance_threshold | 0.00625 |
n_snps_input | 20 |
n_snps_after_qc | 8 |
n_samples | 283 |
n_significant | 0 |
lambda_gc | 33.578414502599976 |
Execution trace
Reconstructed from the parameters stored with this result — represents the Python/R calls the analysis service made.
# app.services.gwas_qc_service — SNP QC + allele encodingfrom sklearn.linear_model import LogisticRegressionfor snp in snp_matrix.columns: # per-SNP association test model = LogisticRegression(max_iter=1000).fit(X_snp, y) p = association_pvalue(model)fdr = statsmodels.stats.multitest.multipletests(p_values, method='fdr_bh')