Result Detail – Clustering
Result Information
- Result ID
- 33
- Type
- Clustering
- Status
- completed
- Dataset ID
- 712
- Created
- 2026-09-21 02:17:13.556421
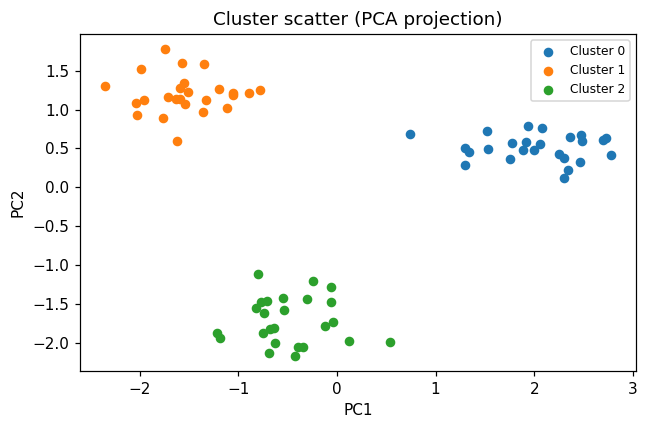
Clustering Result – Kmeans
- Method
- Kmeans
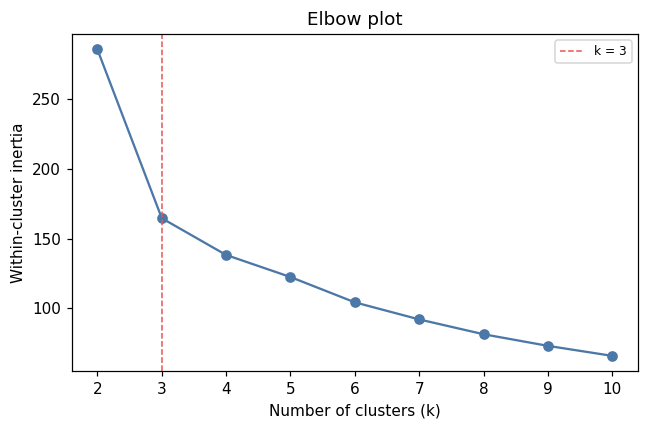
- Clusters (k)
- 3
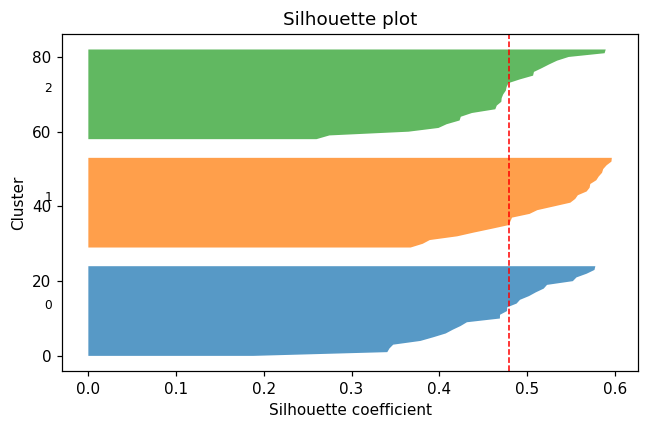
- Silhouette score
- 0.4792 (higher = better separated)
- Rows clustered
- 75
- Feature columns
- f1, f2, f3, f4, f5, f6
Cluster sizes
Cluster 0: n=25
Cluster 1: n=25
Cluster 2: n=25
Per-cluster feature means
| Cluster | f1 | f2 | f3 | f4 | f5 | f6 |
|---|---|---|---|---|---|---|
| 0 | 6.134 | 6.045 | 5.815 | -0.05513 | -0.3117 | 0.1327 |
| 1 | -0.03784 | 8.314 | 0.04768 | 6.028 | 0.02641 | -0.1617 |
| 2 | 0.08804 | 0.121 | -0.06625 | -0.05106 | -0.1555 | -0.07231 |
Figures
Derived Dataset — Ready for Downstream Analysis
The output of this run was saved as a new dataset, gallery — example_clustering.csv (clustered), which you can select in any downstream analysis (machine learning, statistical tests, further preprocessing, or feature selection).
Preview Dataset Open in Editor Run Another Analysis →Pathway Analysis (same dataset)
Method & Provenance
- Method
- Clustering — K-Means
- Method key
kmeans(result type:clustering, result #33)- Engine
- Python · scikit-learn v1.8.0
- Dataset(s)
- #712 gallery — example_clustering.csv
- Status
- completed
- Permanent link
- https://cat-g-omxpert.wishartlab.com/results/by-token/952c914477ed424c80fc8abe48b2dd16 Bookmark or share this URL — it does not depend on your session.
- Created
- 2026-09-21 02:17:13.556421
Parameters used
| Parameter | Value |
|---|---|
cluster_method | kmeans |
feature_cols | f1, f2, f3, f4, f5, f6 |
n_clusters | 3 |
Execution trace
Reconstructed from the parameters stored with this result — represents the Python/R calls the analysis service made.
from sklearn.cluster import KMeanslabels = KMeans(n_clusters=3, n_init=10, random_state=42).fit_predict(X)silhouette = sklearn.metrics.silhouette_score(X, labels)