Pipeline type: MOFA2
MOFA+ Results
Total variance explained per view
| View | Total R² |
|---|---|
| gallery — example_metabolomics.csv | 0.166 |
| gallery — example_proteomics.csv | 0.001 |
MOFA2
0.7.5
ok
Data-adequacy warnings:
- view 'gallery — example_metabolomics.csv' has 11 features (< 15)
- view 'gallery — example_proteomics.csv' has 11 features (< 15)
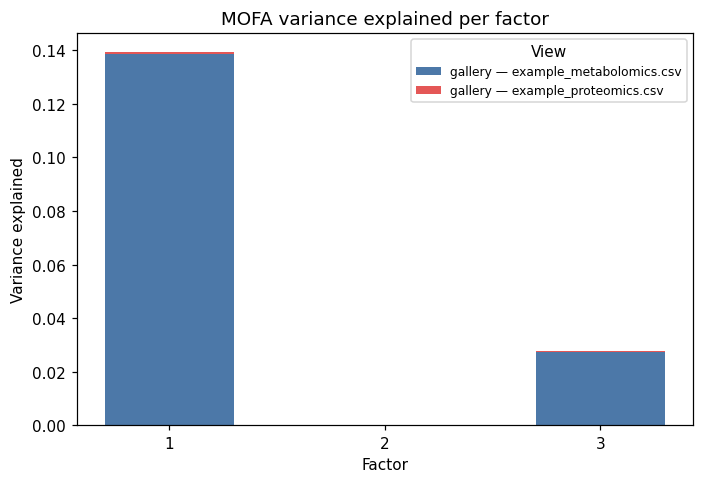
Variance Explained (view × factor)
Variance explained per view and factor
| View | Factor 1 | Factor 2 | Factor 3 | Total |
|---|---|---|---|---|
| gallery — example_metabolomics.csv | 0.1385 | 0.0000 | 0.0272 | 0.1657 |
| gallery — example_proteomics.csv | 0.0009 | 0.0000 | 0.0003 | 0.0013 |
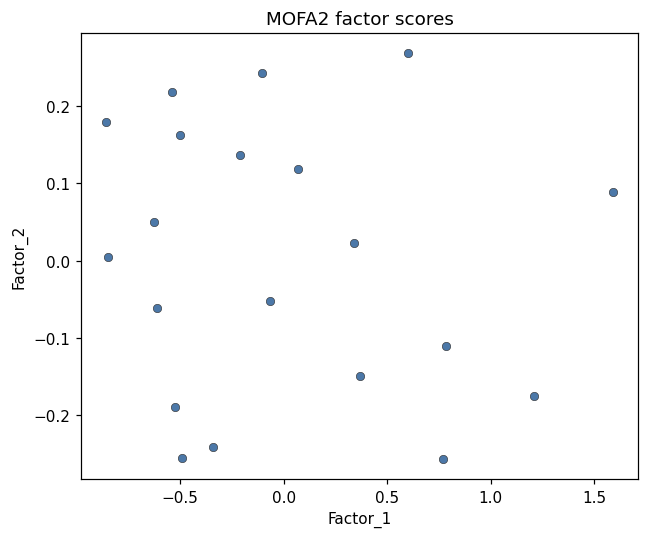
Factor Scatter (Factor 1 vs Factor 2)
Figures
MOFA2 factor scores
Download PNG
mofa variance bar
Download PNG
Method & Provenance
- Method
- Multi-omics — MOFA2
- Method key
mofa2(result type:mofa2, result #91)- Engine
- Python · mofapy2 v0.7.5
- Dataset(s)
- #720 gallery — example_metabolomics.csv
- Status
- completed
- Permanent link
- https://cat-g-omxpert.wishartlab.com/multiomics/results/by-token/cea42a29cdd8490685f8217ef2055842 Bookmark or share this URL — it does not depend on your session.
- Created
- 2026-09-21 02:18:34.569473
- Completed
- 2026-09-21 02:18:35.258126
Parameters used
| Parameter | Value |
|---|---|
dataset_ids | — |
pipeline_type | mofa2 |
Execution trace
Reconstructed from the parameters stored with this result — represents the Python/R calls the analysis service made.
from mofapy2.run.entry_point import entry_pointent = entry_point()ent.set_data_options(scale_views=True)ent.set_model_options(factors=10)ent.set_train_options(iter=1000, convergence_mode='fast', seed=42)ent.build()ent.run()