Results & Reports
When an analysis finishes, its results — tables, statistics, and figures — are stored for review and export.
Live Results Viewer
The Results page renders each stored result as interactive tables and Plotly charts. Both Authenticated Users and Guests can access this viewing plane.
The list supports filtering and search: use the filter bar at the top to scope results to a single project, restrict to one result type, sort by date/dataset/ID, or search by dataset name, method or result number. The Download this list as CSV button exports exactly the filtered view. From a project page, View Results opens the same list pre-filtered to that project. Individual result pages offer CSV, Excel and PDF exports plus per-table CSV downloads where available.

Interactive Results Viewer
Generated PDF Reports
The /reports feature builds downloadable combined reports detailing scientific methods, parameters used, and primary conclusion metrics for a dataset, project, or individual result. Both Authenticated Users and Guests can generate reports — access is scoped to your own results: authenticated users see reports for their account's datasets, and guests see reports for results created in their current browser session.
Reports are also shareable without an account. Every result has an unguessable share token: appending ?token=<token> to a report URL (for example /reports/result/<id>?token=<token>) opens that report to anyone holding the link — useful for sending a read-only report to a collaborator who does not have a login. The token authorizes only that specific result's report; it does not expose the rest of your workspace.
Available formats: on-screen HTML plus downloadable report.html, report.pdf, report.docx, report.md, and a bundled report_md.zip (Markdown with embedded figures) under /reports/<scope>/<id>/, where <scope> is dataset, project, or result.
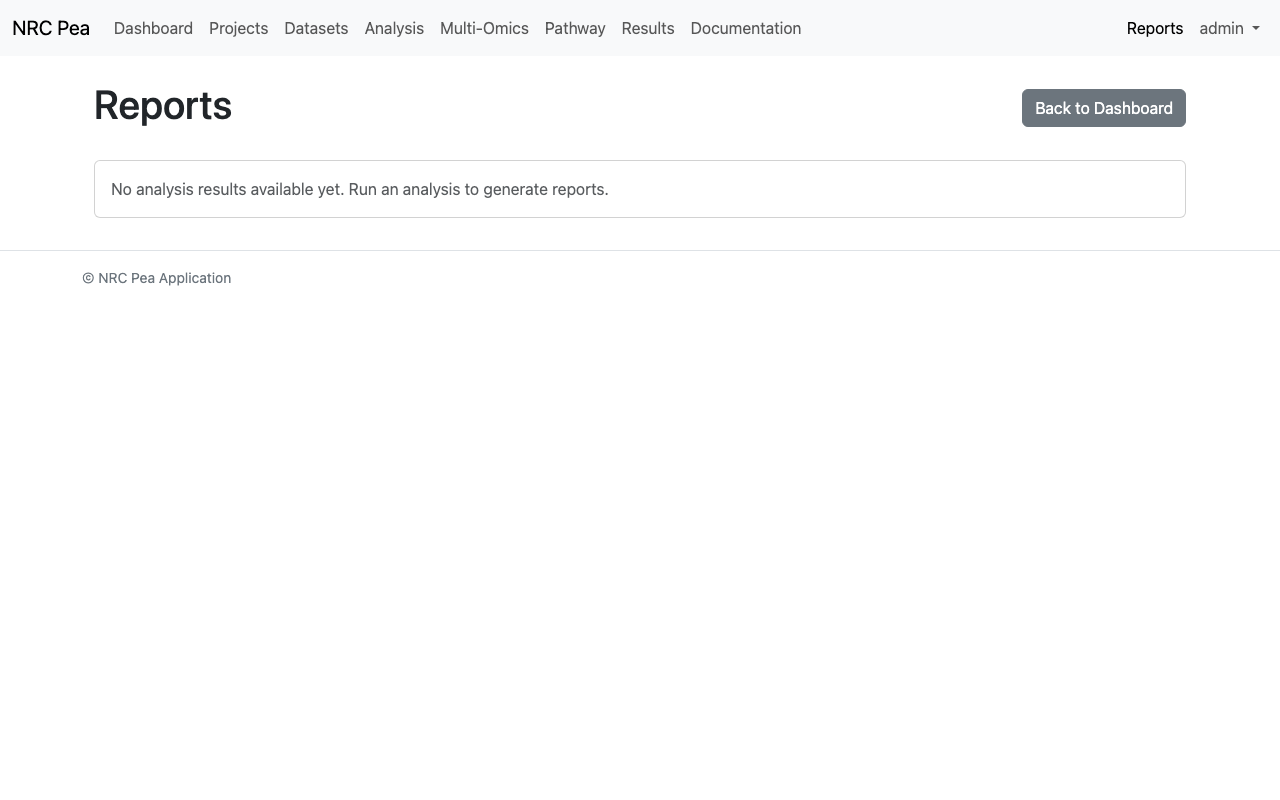
Reporting Engine Interface
Comparison Parameter Guide
Reference for the results comparison controls used on the Compare Results page.
Baseline Analysis
The reference result against which the comparison analysis is evaluated. Metrics and charts are reported relative to this baseline.
Comparison Analysis
The result whose performance is compared against the baseline, e.g. a differently tuned model or an alternative dataset.